The Frayed Rope Sequence
A sequence of David Sycamore, analyzed by Michael De Vlieger.
Written by Michael Thomas De Vlieger, St. Louis, Missouri, 2020 1010.
Abstract.
We examine OEIS A340138, generated starting from 0 by finding the smallest unique number m that has a digit d equivalent to the decimal digital root of the last-generated term. This sequence has a plot that trends along slope 1, never varying far from a line with that slope. The sequence is likely a permutation of the natural numbers.
Introduction.
Consider the self-referential sequence beginning with a(1) = 0, and a(n) = the least m not already in the sequence such that the digital root d(a(n − 1)) = digit d is found somewhere among the digits of m.
The digital root d(n) is the fixed point of the recursive summation of the decimal digits of n. Therefore, d(974) = 9 + 7 + 6 = 22; 2 + 2 = 4. We observe that the digital root results in a single decimal digit 0..9, however, we only obtain 0 when n = 0. Therefore:
d(0) = 0, d(n) = n mod 9 + [n mod 9 ≡ 0] (Iverson brackets).
The sequence a(n) begins (Click here to see an OEIS b-file style list of the smallest 101002 terms; see Code 1.0):
0, 10, 1, 11, 2, 12, 3, 13, 4, 14, 5, 15, 6, 16, 7, 17, 8, 18, 9, 19, 21, 23, 25, 27, 29, 20, 22, 24, 26, 28, 31, 34, 37, 41, 35, 38, 32, 45, 39, 30, 33, 36, 49, 40, 42, 46, 51, 56, 52, 47, 62, 48, 43, 57, 53, 58, 44, 68, 50, 54, 59, 55, 61, 67, 64, 71, 78, 60, 63, 69, 65, 72, 79, 70, 73, 81, 89, 80, 82, 91, 100, 101, 92, 102, 83, 112, 74, 120, 93, 103, 84, 113, 75, 123, 66, 130, 94, 104, 85, 114, 76, 124, 77, 95, 105, 86, 115, 87, 96, 106, 97, 107, 88, 117, 90, 98, 108, 99, 109, 110, ...
For our purposes, let the term “rank” herein signify the exponent e of 10e in a decimal integer expressed in standard positional notation. Thus, in the decimal number 123, the “3” appears in rank 0, the “2” in rank 1, etc. We refer to intervals and this refers to a range of indices n as noted.
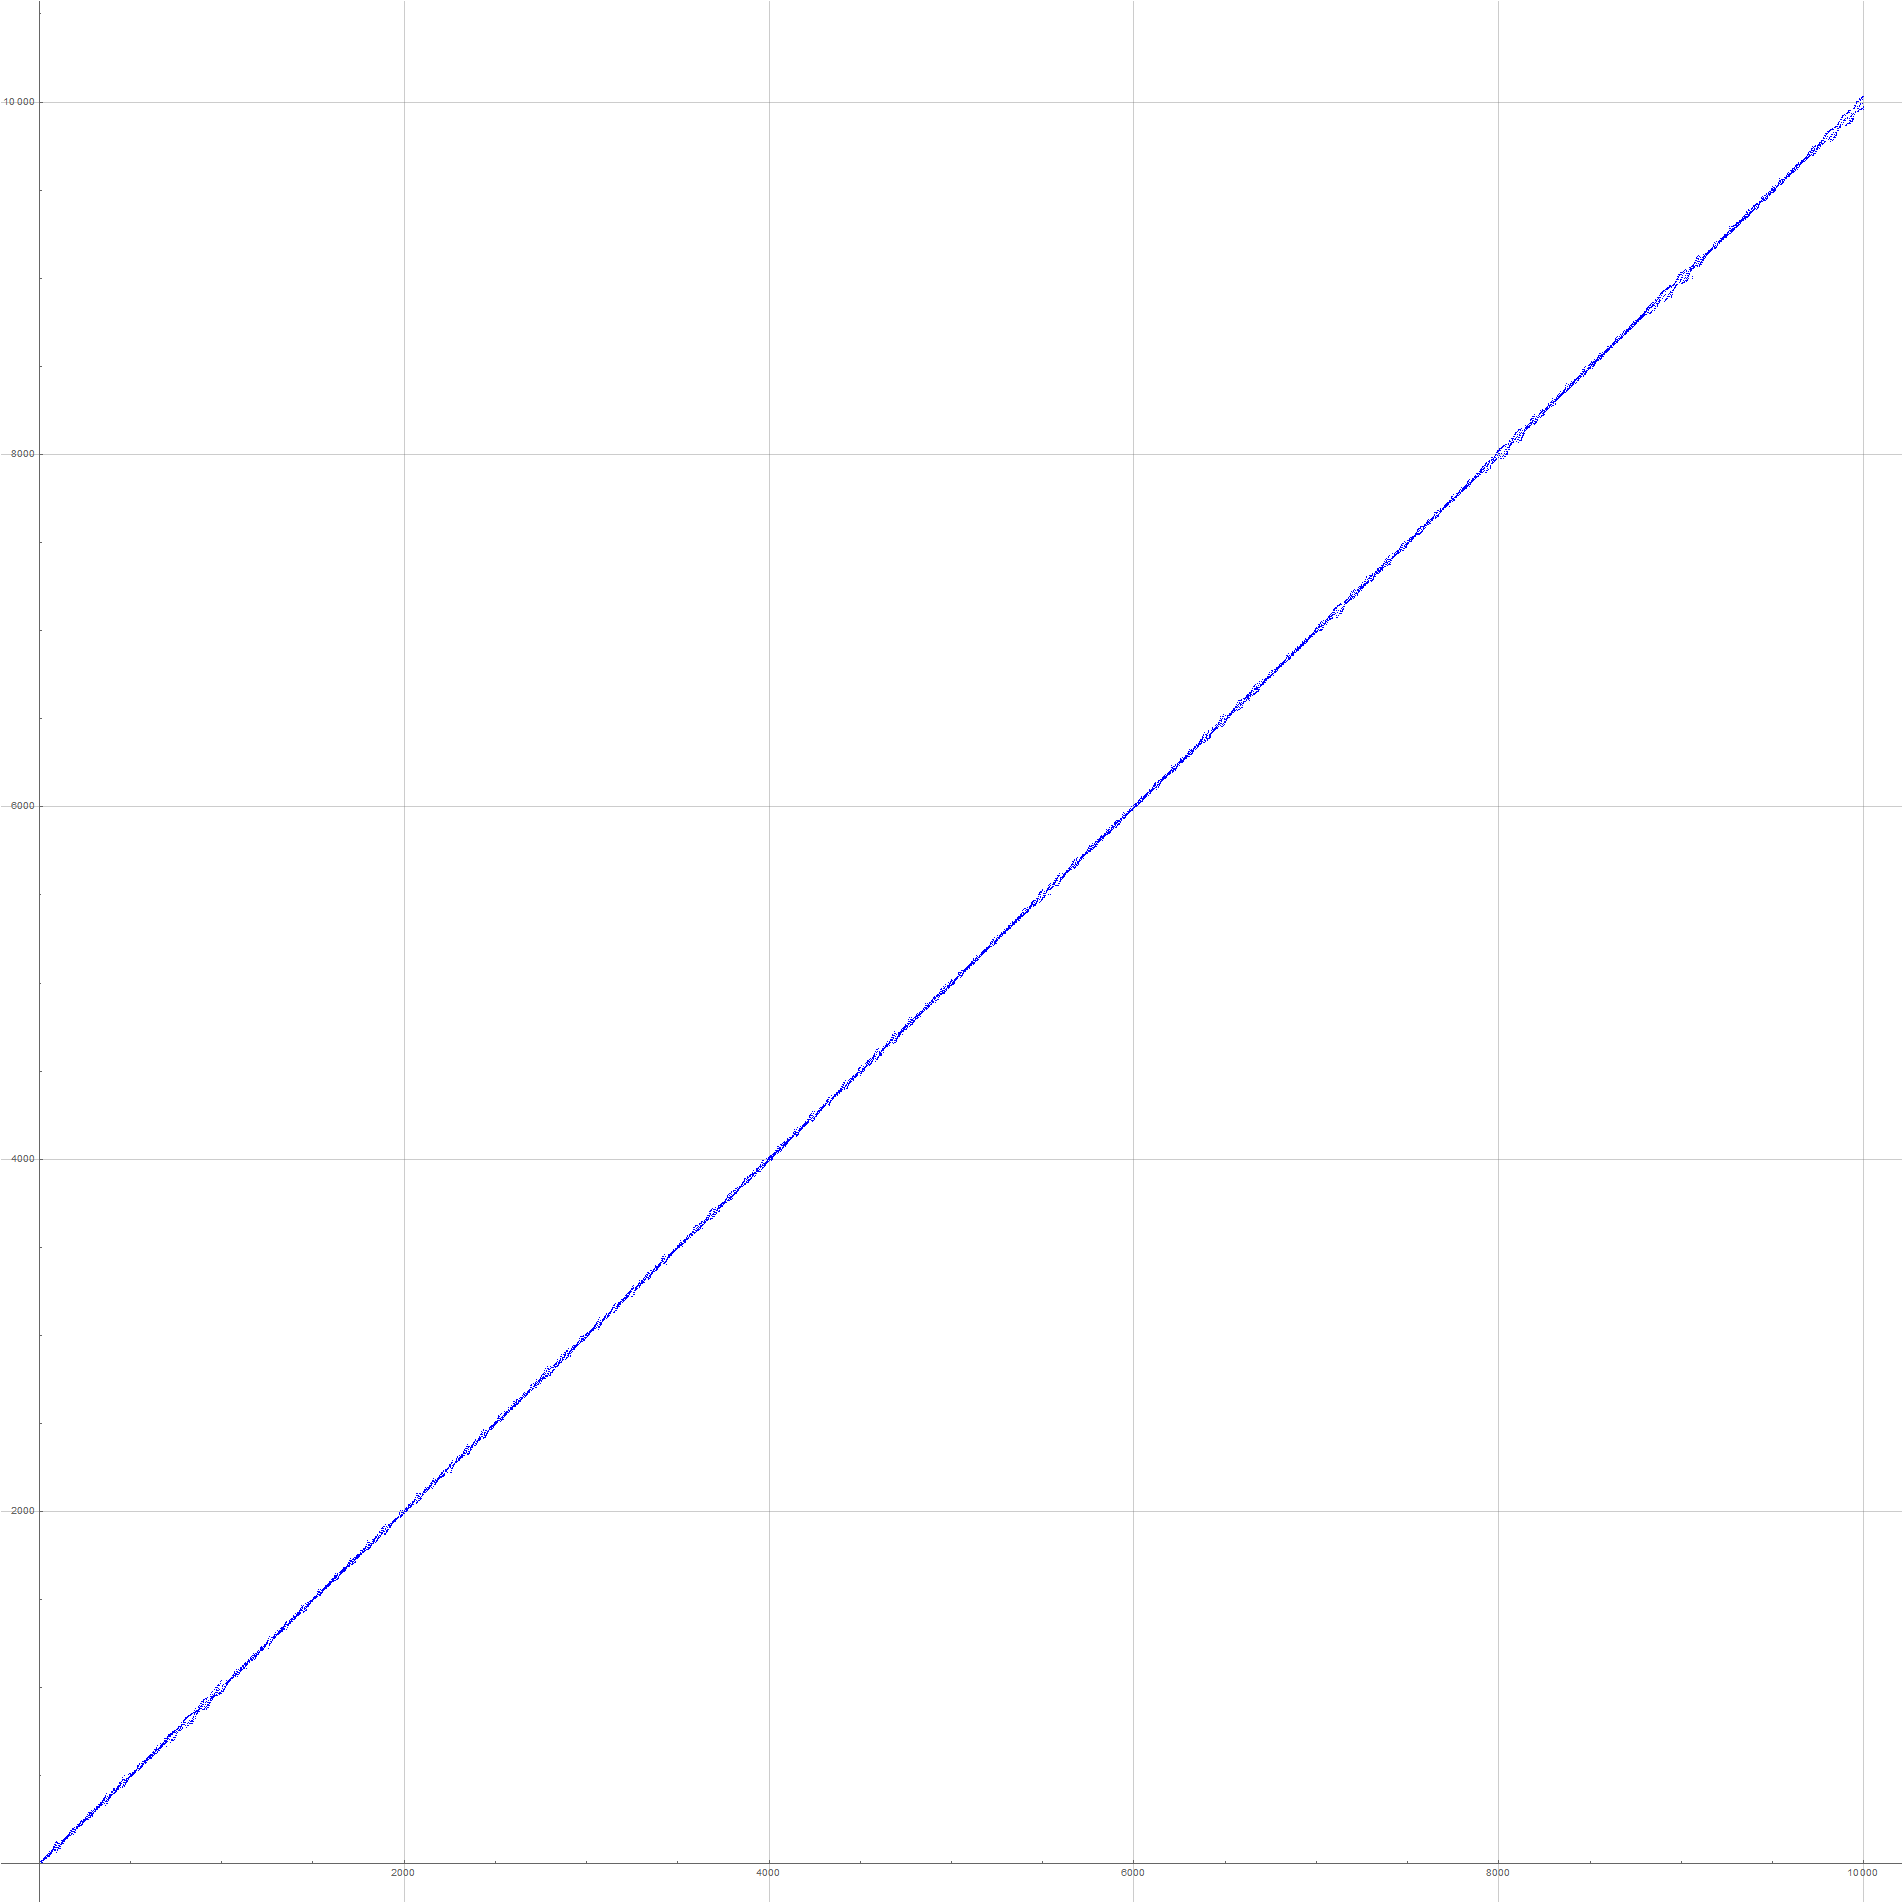
Figure 1.1 plots for 1 ≤ n ≤ 1000:

The plot remains rather tight around the slope 1, but experiences episodes of “fraying”, hence the nickname of the sequence. (Click here to see a plot of a(n) for 1 ≤ n ≤ 10000; see Code 1.1)
Table 1.1 lists the position of 10k in a(n):
k n 10^k - n
--------------------
0 3 -2
1 2 8
2 81 19
3 965 35
4 9958 42
5 99958 42
...
For k > 0, it seems a(n) = 10k occurs before n = 10k. Is it always true?
Zeros and record transforms.
Let’s analyze some aggregate properties of the sequence a(n).
We note that the least unused number u ≤ n has difference n − u that is never very great, often reconciling with n such that n − u = 0. We may define a sequence u(n) as the leased unused number in a(n) at index n (see Code 1.2):
1, 1, 2, 2, 3, 3, 4, 4, 5, 5, 6, 6, 7, 7, 8, 8, 9, 9, 19, 20, 20, 20, 20, 20, 20, 22, 24, 26, 28, 30, 30, 30, 30, 30, 30, 30, 30, 30, 30, 33, 36, 40, 40, 42, 43, 43, 43, 43, 43, 43, 43, 43, 44, 44, 44, 44, 50, 50, ...
Similarly, we can find a high water mark h that records the largest m seen in a(n) as n increases, and define a sequence h(n) (see Code 1.3):
0, 10, 10, 11, 11, 12, 12, 13, 13, 14, 14, 15, 15, 16, 16, 17, 17, 18, 18, 19, 21, 23, 25, 27, 29, 29, 29, 29, 29, 29, 31, 34, 37, 41, 41, 41, 41, 45, 45, 45, 45, 45, 49, 49, 49, 49, 51, 56, 56, 56, 62, 62, 62, 62, ...
The records in a(n) are thus the union of h(n):
0, 10, 11, 12, 13, 14, 15, 16, 17, 18, 19, 21, 23, 25, 27, 29, 31, 34, 37, 41, 45, 49, 51, 56, 62, 68, 71, 78, 79, 81, 89, 91, 100, 101, 102, 112, 120, 123, 130, 134, 135, 138, 142, 147, 152, 158, 159, 160, 167, 169, ...
We can find many points such that a(n) − n = 0. We may define the sequence Z as that which contains all the indices where a(n) − n = 0 (see Code 1.4):
8, 21, 31, 35, 39, 46, 72, 105, 121, 146, 148, 153, 196, 206, 214, 218, 247, 249, 273, 315, 326, 372, 386, 448, 473, 483, 489, 517, 523, 541, 635, 675, 747, 869, 893, 947, 974, 983, 1006, 1035, 1096, ...
Among the high-water marks or records in a(n), we can find differences a(n) − n that themselves set records and record their indices in a superior sequence r. The first terms of the superior sequence r (see Code 1.5):
1, 2, 51, 77, 81, 86, 88, 96, 965, 976, 982, 9091, 9958, 9976, 98184, ...
Likewise, in the sequence u, we can find differences n − a(n) that set records and record their indices in an inferior sequence s. The first terms of the inferior sequence s:
1, 3, 5, 7, 9, 11, 13, 15, 17, 19, 57, 93, 95, 364, 698, 723, 734, 737, 842, 8026, 8943, 9058, ...
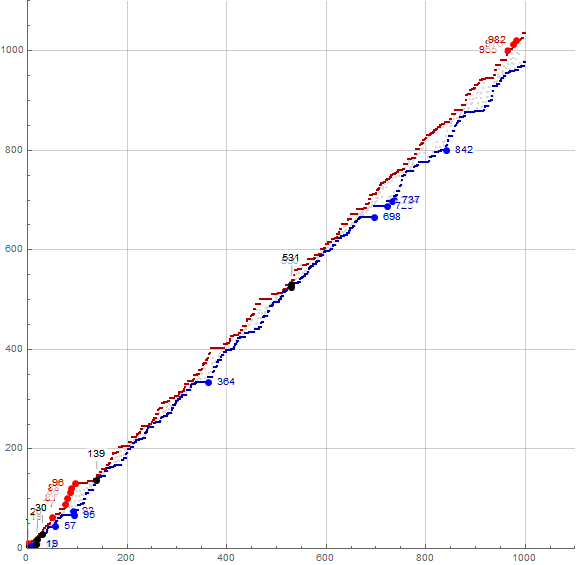
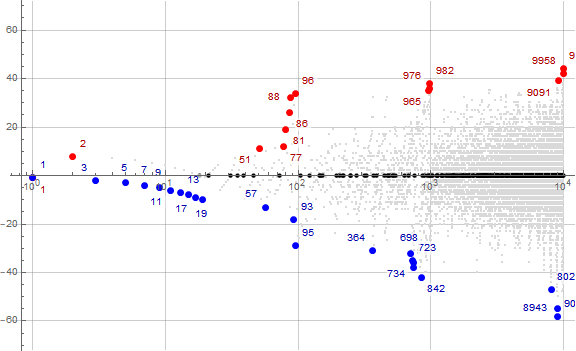
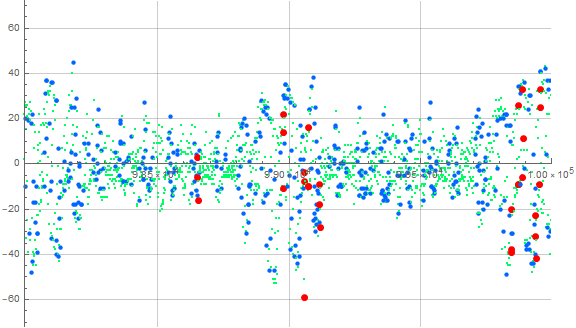
Figure 2.1 generally plots a(n) in gray for 1 ≤ n ≤ 1000, but shows h(n) in dark red, and u(n) in dark blue. Zeroes in a(n) − n are marked in black and some are labeled. Recordsetters r in a(n) − n appear in large red points, some labeled. Minima in n − a(n) appear marked by large blue dots, also some of these are labeled. (See Code 2.1)
Because the plot generally follows the slope 1, we might achieve a deeper analysis by running a log 10 plot of a(n) − n instead of a(n), as the values are never very far apart.
Figure 2.2 is a plot (x, y) = (n, a(n) − n), with 1 ≤ n ≤ 10000, using a logarithmic scale on x. (Click here for a magnification of this plot; see Code 2.2)
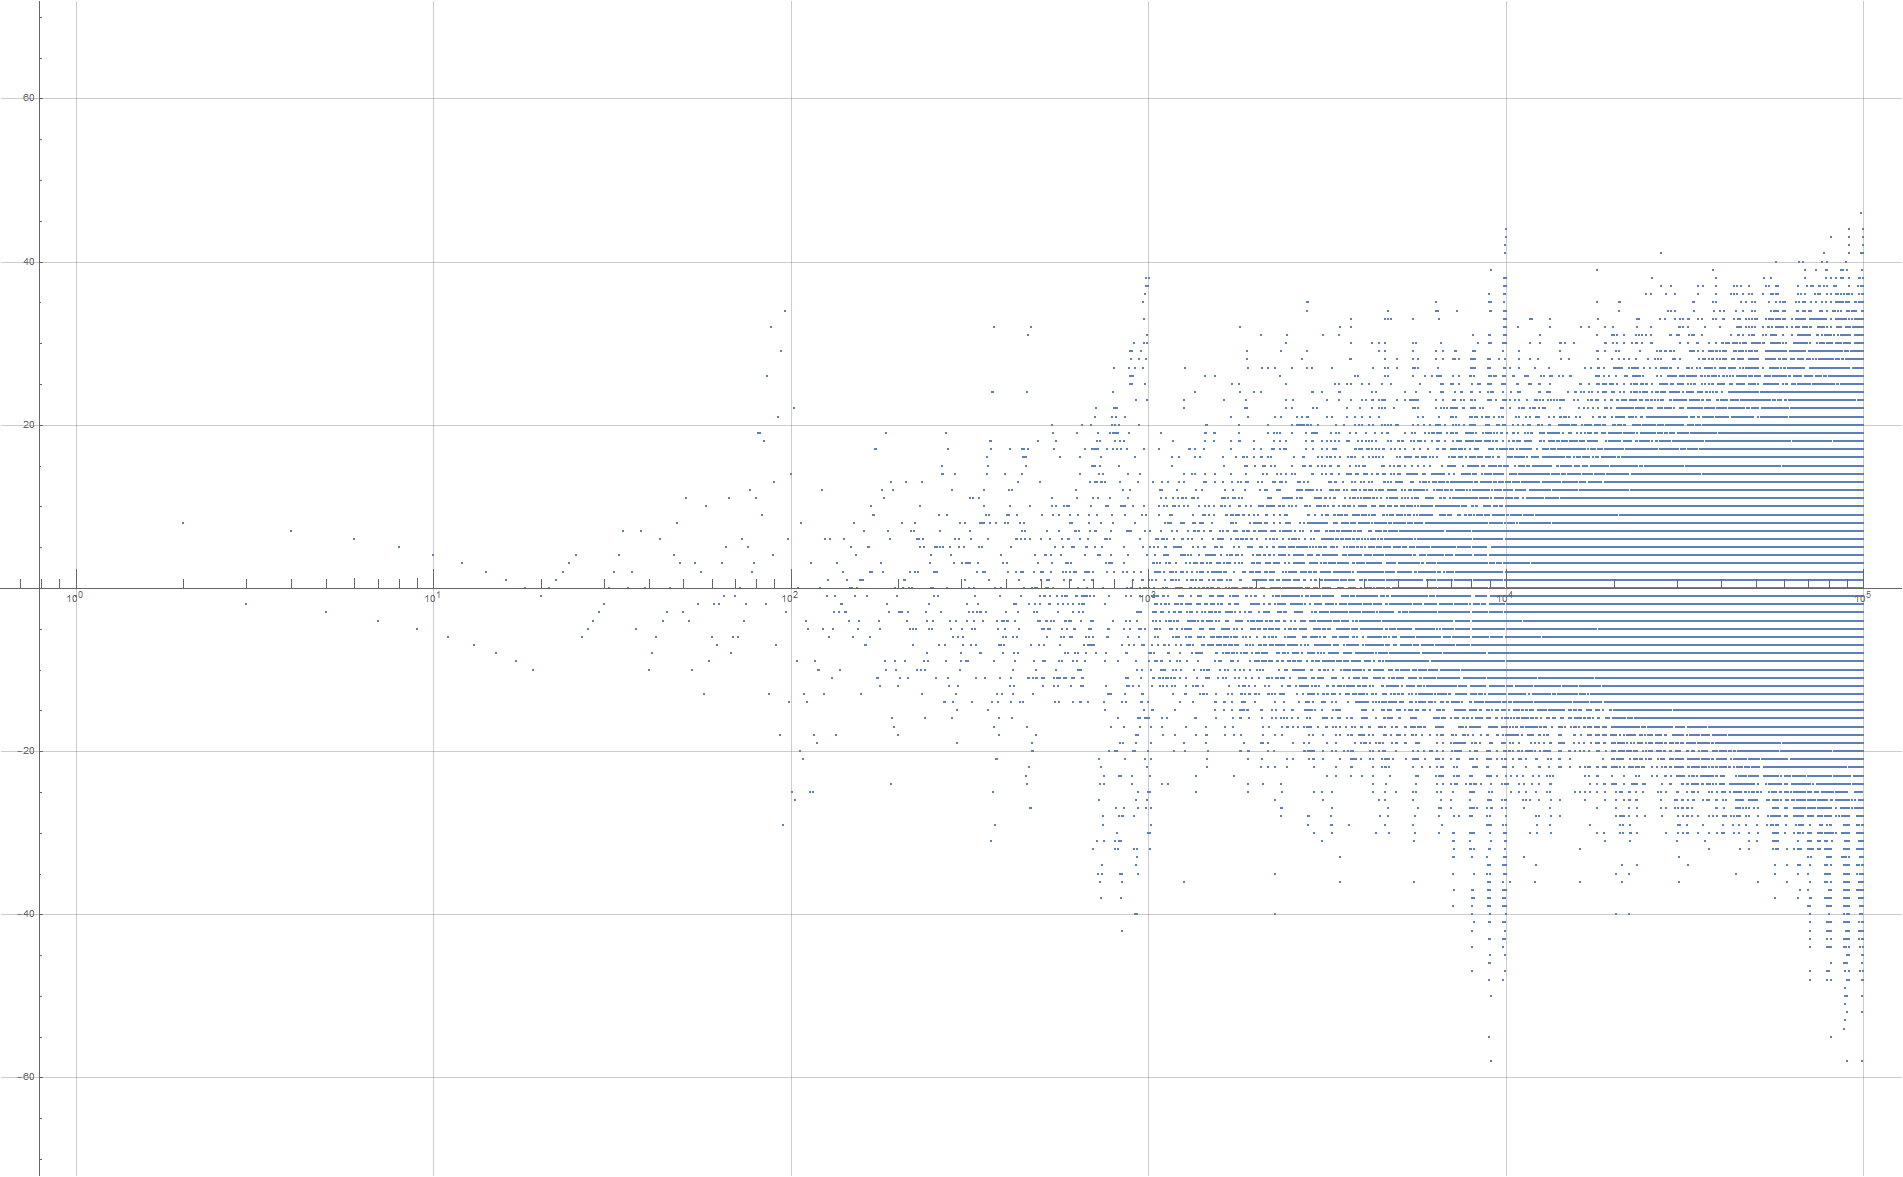
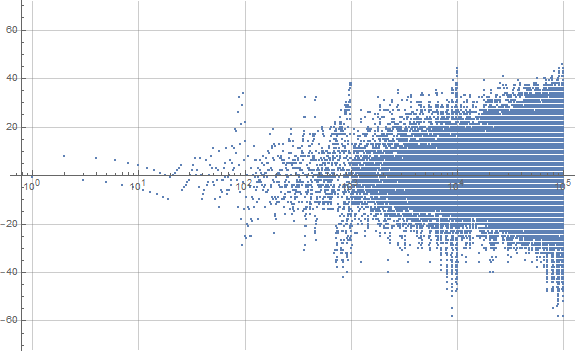
Figure 2.3 is the same logarithmic plot as Figure 2.2, but indicates the zeros in black, the superiors r in red, many labeled, and the inferiors s in blue, also many labeled. (See Code 2.3)
Records in a(n) are very common and make little sense to plot (see the plot here).
Schema of Questions Relating to Sequence Mechanics.
Now that we’ve dissected basic parameters of the plot, we turn to the mechanics of the sequence.
The chief question seems to be whether or not the sequence is a permutation of the natural numbers, given the requirement for a least m novel to the sequence.
There are several principal features of the sequence to consider.
First is the digit d = d(a(n − 1)) that we seek among the digits of m novel to the sequence. This digit is one of 9, with d = 0 available only for a(n − 1) = 0, therefore we might examine the sequence mod 9. Are all residues present? Are the residues evenly represented? How are the residues distributed in the plot? Is there any pattern? When we determine the digital root of the previous term, does the same root d appear in succession? How long is the succession? What is the effect of a succession of the same d, and what is the distribution of repeated invocations of d—do they cluster? What is the maximum run length of the same d? What would a parity map of the plot look like? Are even and odd terms evenly distributed or is there a pattern?
Second is the least rank in m where digit d occurs. Since we aim to find a least novel m, it would seem that the rank would preferably be 0 or at least a low rank, though at times a number with higher rank may be available naturally. If preferable, a low rank would dominate the upper portion of the log plot of a(n) − n; this suggests that these tend to appear generally early.
Third is the examination of the available numbers U, which is infinite starting with 1. Can we find the least available number u(n) for a given n? Looking at U, we see that numbers of a particular rank-interval (here we shall just refer to such as an interval) 10e..10(e + 1) − 1 offer a number of available instances of each digit d. What is the usage pattern of these digits? When the instances of d available in a given interval are exhausted, does this impact the plot?
Finally, as regards the plot, what is the reason for the slope of 1 and the tightness of the data around the slope? What causes the “frays” or “braids” which in the log plot of a(n) − n show instead as spikes or cusps? Why does there seem to be a culmination at the close of an interval 10e..10(e + 1) − 1? What is the spacing or pitch of the cusps? Why does there seem to be cusps of different scales? Why is the sequence a(n) − n more prominently negative even if slightly, yet the slope is still plausibly 1 starting from origin?
Digit-Rank Exhaustion.
The logarithmic plot of (x, y) = (n, a(n) − n) (cf. Figures 2.2 and 2.3) seems to indicate that we are exhausting the supply of digit d in numbers with e digits. Therefore, as we approach a decimal rank 10e, we see a dithering between e and (e + 1)-digit numbers. The dithering is merely the jump in the differences between a(n − 1) and a(n) as certain d are exhausted and others not. In the interval 10e..10(e + 1) − 1, we have 10e + 9e × 10(e − 1) digits d > 0, but only 9e × 10(e − 1) zeros. However, sometimes we must choose a number with more than 1 digit d, “wasting” the others that come with the one we’re after in a particular number. Therefore we are reduced to:
9×10(e − 1) − 8×9(e − 1) digits d > 1, and
9×10(e − 1) − 9e digits d = 0.
The fact is that we are never looking for 0 except in the very first iteration, 0 → 10.
Therefore the number of digits is the same for all d in a given interval 10e..10(e + 1) − 1 outside of the initial distortion. The data show that, for e ≤ 5, d = 1 is the first digit to be exhausted.
We find 10e in a(n) at indices {3, 2, 81, 965, 9958, 99958, …}, which is the point of exhaustion of 1s for interval 10e..10(e + 1) − 1. Generally the exhaustion of digit d in numbers with e digits occurs in a tight range shown in the table below:
Table 3.1: Exhaustion of digit d in numbers in the interval 10e..10(e + 1) − 1.
Rank
d 1 2 3 4 5 6
-----------------------------------------
1: 3 2 81 965 9958 99958
2: 5 6 84 969 9961 99961
3: 7 8 90 973 9966 99966
4: 9 10 98 979 9968 99968
5: 11 12 105 1004 9972 99972
6: 13 14 110 1006 9983 99983
7: 15 16 112 1015 10021 100021
8: 17 18 117 1018 10026 100026
9: 19 20 119 1021 10029 100029
Therefore within the interval 81 ≤ n ≤ 119, the sequence “convulses” between numbers with 3 digits and those with 2, first to find d = 1, then d = 2, etc. through d = 9.
Figure 3.1 is a plot (x, y) = (n, a(n) − n) for 1 ≤ n ≤ 101000, indicating the intervals with their start at the top in red, and their end below zero in blue.
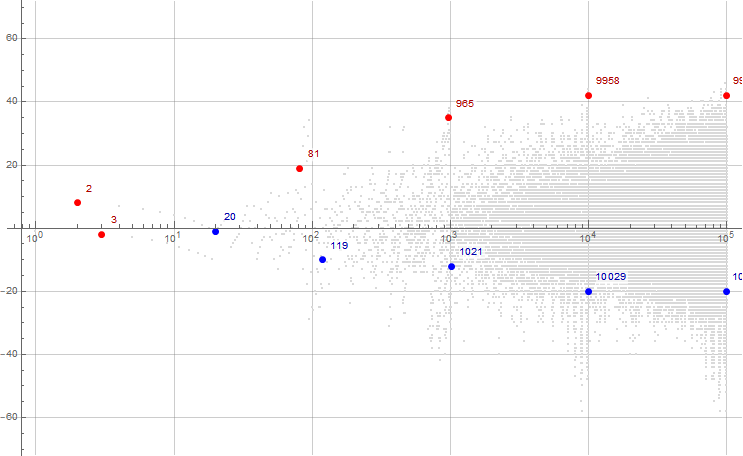
We can produce a function g(x) such that we measure how many digits d are left for a(n) = m. This function requires sequences q(d, n) = A01153d (i.e., A011531 for d = 1, etc.) of numbers that contain the digit 1 ≤ d ≤ 9. We know that there are 9×10(e − 1) − 8×9(e − 1) numbers with at least 1 digit d in the interval 10e..10(e + 1) − 1; this sequence is the first differences of 10n − 9n = A016189. Therefore, we may find the position of a(n) = m in q(d, n), subtracting it from 10e − 9e, where e is the number of digits in m. In this manner we might determine the “exhaustion” of the digit d for an e-digit number m that contains at least 1 digit d.
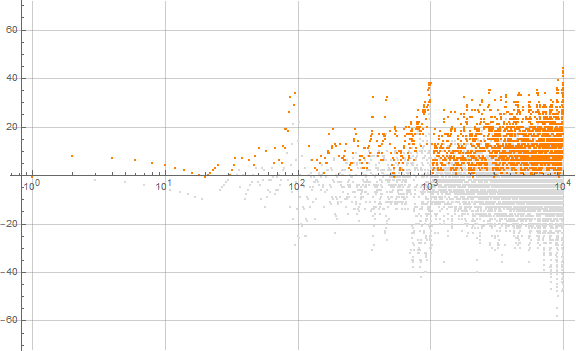
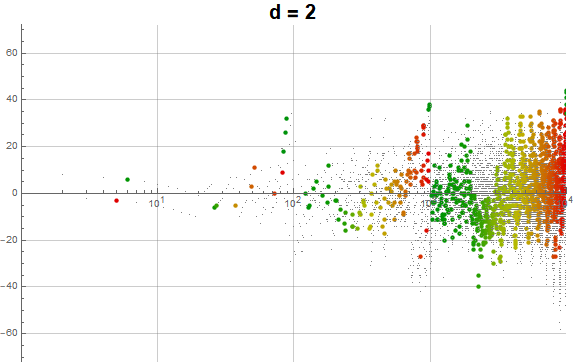
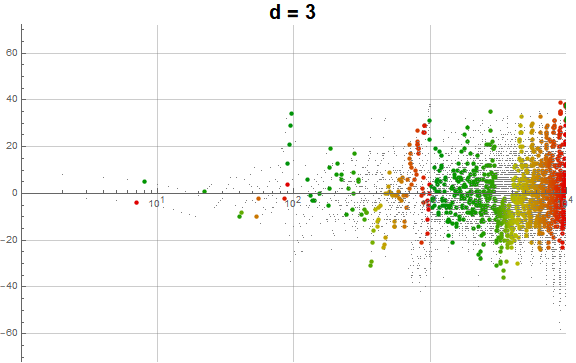
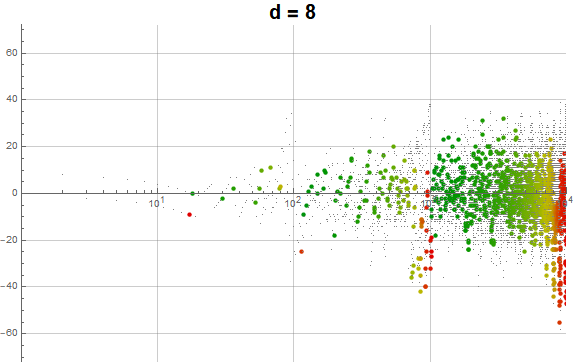
Figure 3.2 illustrates the exhaustion of the digit d in a(n), with “plenty” shown in green and “none” in pure red, proportionally as to g(a(n))/(10e − 9e):
(The size of the dots pertains to the repetition status of the digit d described in the next section.)
Consider the first differences of the sequence q(d, n). Generally we have the first differences 1 and 10. The first difference of 1 is seen when we have d in a rank > 0 and we are incrementing to find another d in that same high rank. The first difference of 10 is seen when we have d at rank 0, but not in any other rank. These both conflate to 1 (mod 9). We see i = d + 1 corresponding to the last d in a nonzero rank followed by the first d in rank 0. And we see j = 10 − d for the last d in rank 0 and the first d in a higher rank. Hence the difference 1 between repeated d is very common, 10 the next most common spacing that occurs in runs of 8 for digits 1..8, but 9 for digit 9. Intermediate i and j appear rarely.
Therefore a positive difference between repeated invocations of d is the only possibility, though a(n) − n can decrease on exit (when another root d results). The decreases may occur when a(n) sums to a different root d. The digit d = 1 has difference 1 very often, whereas larger digits increasingly feature the difference 10 when n is small.
We contrast this to the spread between the values of q(d, n) for 1 ≤ d ≤ 9, holding n constant. When n is in A016189 the spread is minimal. For instance, at n = 271, the values are {991, 992, 993, 994, 995, 996, 997, 998, 999}. Between the values, we have quite a marked difference for q(d, n). Example: for n = 138, we have {291, 299, 380, 461, 542, 623, 704, 748, 749}. We find 500 + d at n = {177, 177, 177, 177, 101, 96, 96, 96, 96}. Therefore, despite the differences in exhaustion that we can see in the middle ranges of the intervals of Figure 3.2, we may see the value of q(d, n) remain rather similar.
The sign and magnitude of the difference between terms in a(n) seem to be largely attributable to the changing of d, that tend to nearly cancel one another out as n increases.
Figure 3.2 demonstrates that the culmination of the intervals is coincident with the exhaustion of e-digit numbers with at least 1 instance of digit d, especially as e increases. It is evident, however, that there are other structures in the plot that are not explained by digit-rank exhaustion in the most significant rank of m, but in intermediate ranks as well.
Run Lengths of Consecutive Digits d.
Because we are looking to find the least m that has digit d, we normally find d in the lowest rank 0, i.e., in the 100 = ones place. We might define a sequence e(n) = least rank where digit d is found.
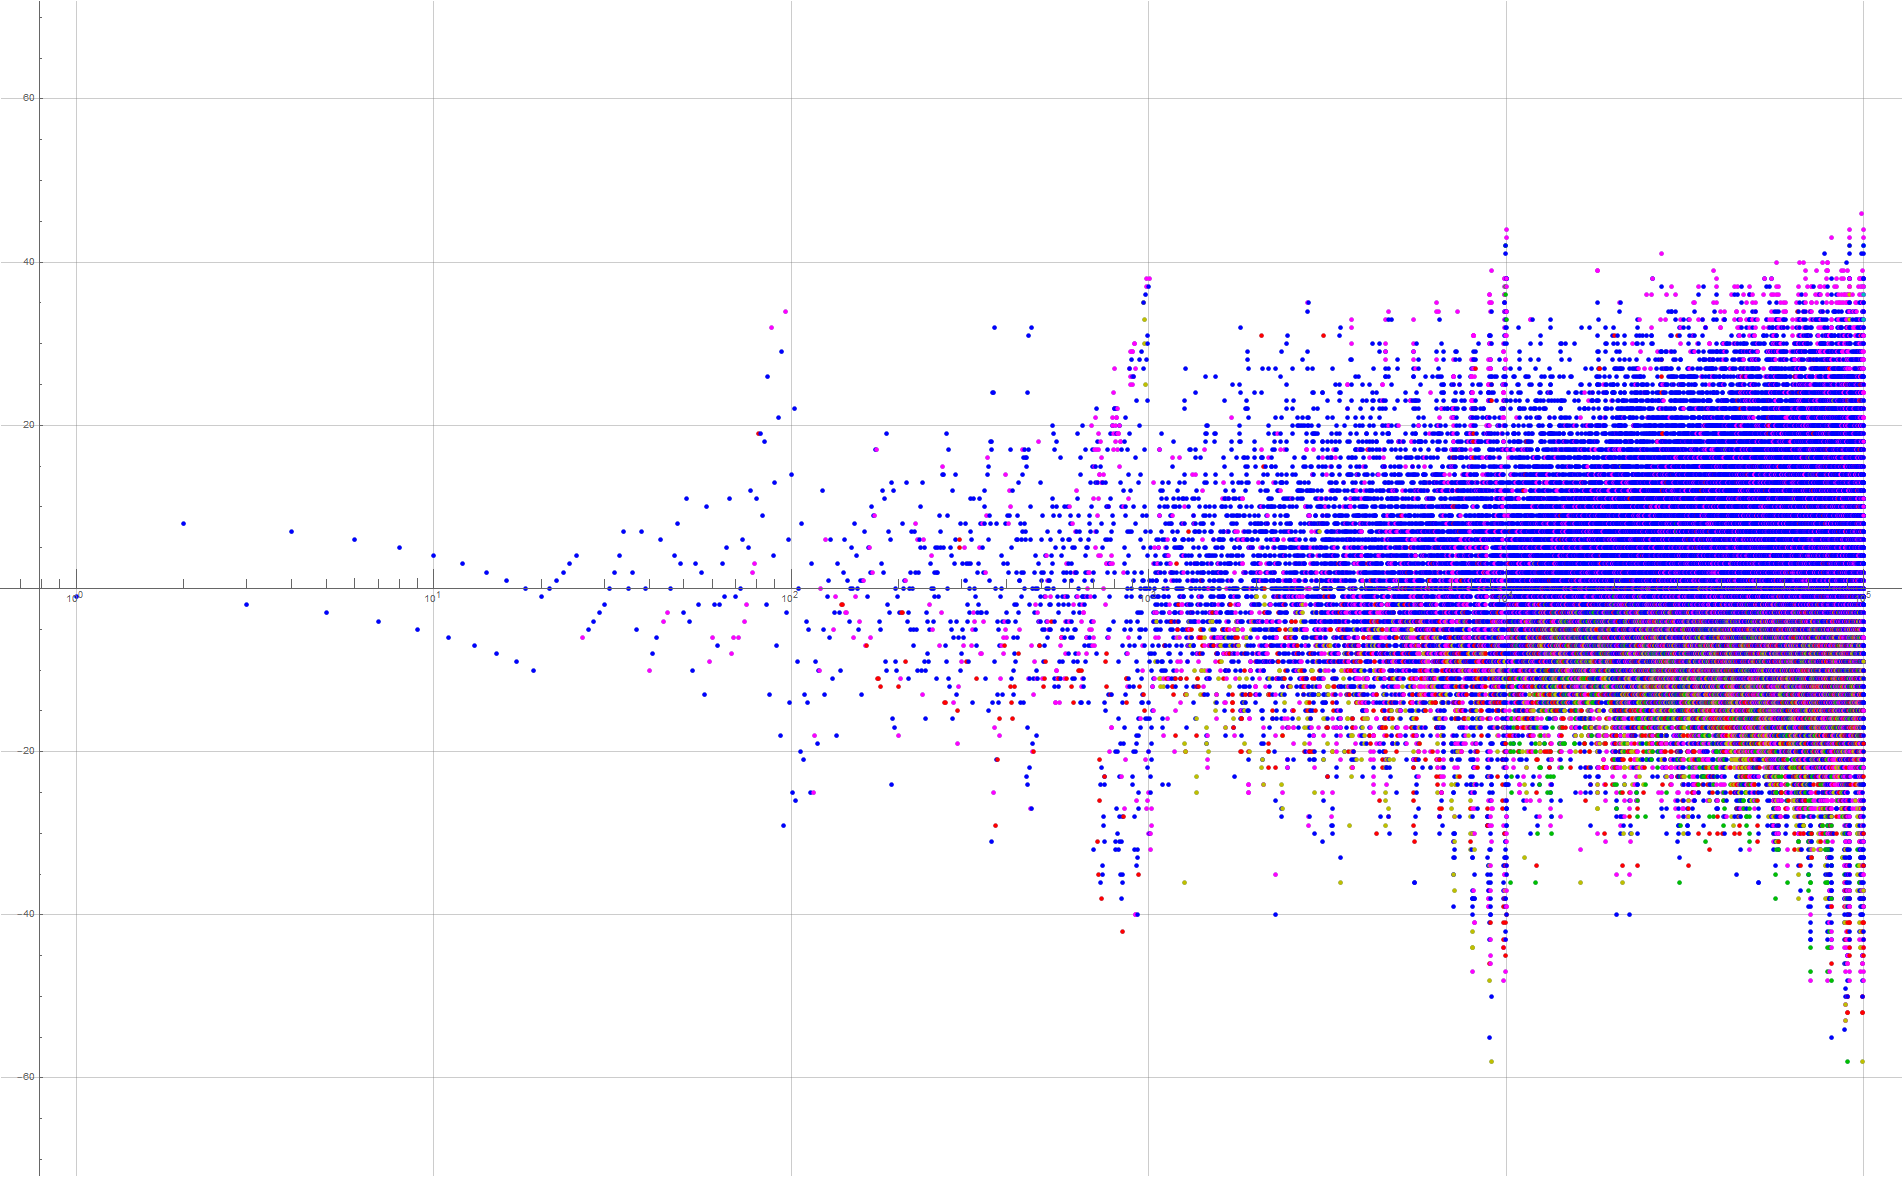
Figure 4.1 is a plot (x, y) = (n, a(n) − n) for 1 ≤ n ≤ 10000 that uses a color code to show the locations where we find d, with blue pertaining to rank 0 (the ones place), magenta to rank 1 (the tens place), red to rank 2 (hundreds), orange to rank 3 (thousands), and green to rank 4. (See a an enlarged chart covering 1 ≤ n ≤ 100000)
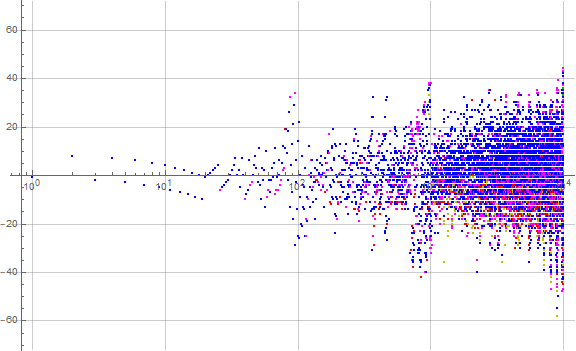
Figure 4.1 seems to indicate that d in the larger ranks tends to be found later, for a(n) − n negative, while d in rank 0 is found ahead of schedule. The examination of the enlarged chart covering reveals that the intermediate spiking above or below slope 1 from origin also involves the least rank in m where d is found.
Indeed, when we look at a number in the hundreds, say, 380, we find a run numbers containing 8s that begin with this number and proceed through 389. In these cases, if we are seeking consecutive 8s, we will have a calm incrementation of a(n). But if we have exhausted the 8s in consecutive arrangement, a(n + 1) will jump.
We define sequence ℓ(n) by the number of consecutive residues R (mod 9) in which R ≡ a(n) mod 9 is a part. If R is a singleton, it is assigned 1, but if it is duplicated, both are assigned 2, and part of a trio, 3 (given 100,000 terms of a(n), the largest run is 3).
Obviously, the occasion of repeated invocations of d stems from the difference | a(n) − a(n − 1) | ≡ 0 (mod 9). Therefore we see that such repetitions only occur thrice in a row at most for a(n) with n ≤ 100,000.
The sequence ℓ(n) begins as follows (See Code 3.0):
1, 2, 2, 2, 2, 2, 2, 2, 2, 2, 2, 2, 2, 2, 2, 2, 2, 2, 2, 1, 1, 1, 1, 1, 2, 2, 1, 1, 1, 1, 1, 1, 1, 1, 1, 1, 1, 1, 2, 2, 1, 1, 2, 2, 1, 1, 1, 1, 1, 1, 1, 1, 1, 1, 1, 1, 1, 2, 2, 1, 1, 1, 1, 1, 1, 1, 2, 2, 1, 1, 1, 1, 2, 2, 1, 1, 2, 2, 3, 3, 3, ...
Remember that ℓ(n) is not the list of run lengths, but rather, a mapping of the run-length to which d(a(n)) belongs; we are attempting to ascertain n for which the digit d sought is repeated. Therefore, for 79 ≤ n ≤ 81 we have d = 1, so ℓ(n) = 3 in that range. Singleton d have ℓ(n) = 1.
Table 4.1 tallies the number of singletons (run length ℓ = 1), doublets (ℓ = 2), and triplets (ℓ = 3) in the interval 10e..10(e + 1) − 1 for 0 ≤ e ≤ 4:
1-------10--------100---------1000----------10000-----------100000
1: 1 57 682 7061 71450
2: 4 15 103 938 9041
3: 1 4 21 156
Table 4.2 features 5 rows, the first is the index n, the second, a(n), the third, a(n) − a(n − 1), the penultimate the digit d sought among the digits of a(n + 1) that is the digital root of a(n), and finally, ℓ(n).
n 78 79 80 81 82 83 84 85 86 87 88 89 90 91 92 93 94 95
----------------------------------------------------------------------------------
a(n) 80 82 91 100 101 92 102 83 112 74 120 93 103 84 113 75 123 66
delta -9 2 9 9 1 -9 10 -19 29 -38 46 -27 10 -19 29 -38 48 -57
d(a(n)) 8 1 1 1 2 2 3 2 4 2 3 3 4 3 5 3 6 3
l(n) 2 3 3 3 2 2 1 1 1 1 2 2 1 1 1 1 1 1
We see the effect of a run of digital roots d that often instigate a large displacement a(n) − a(n − 1), but not always. The effect of digit-rank exhaustion, even within medial ranks, can also instigate a jump in a(n). This is perhaps more evident in the plot shown in Figure 4.2 below.
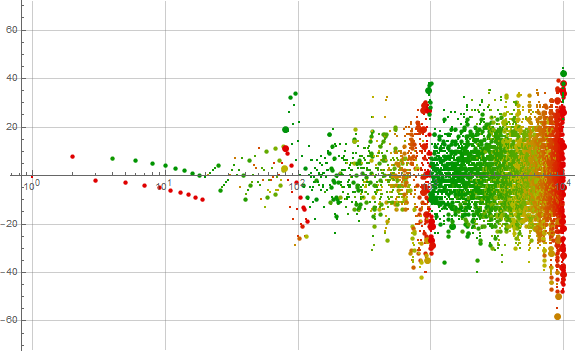
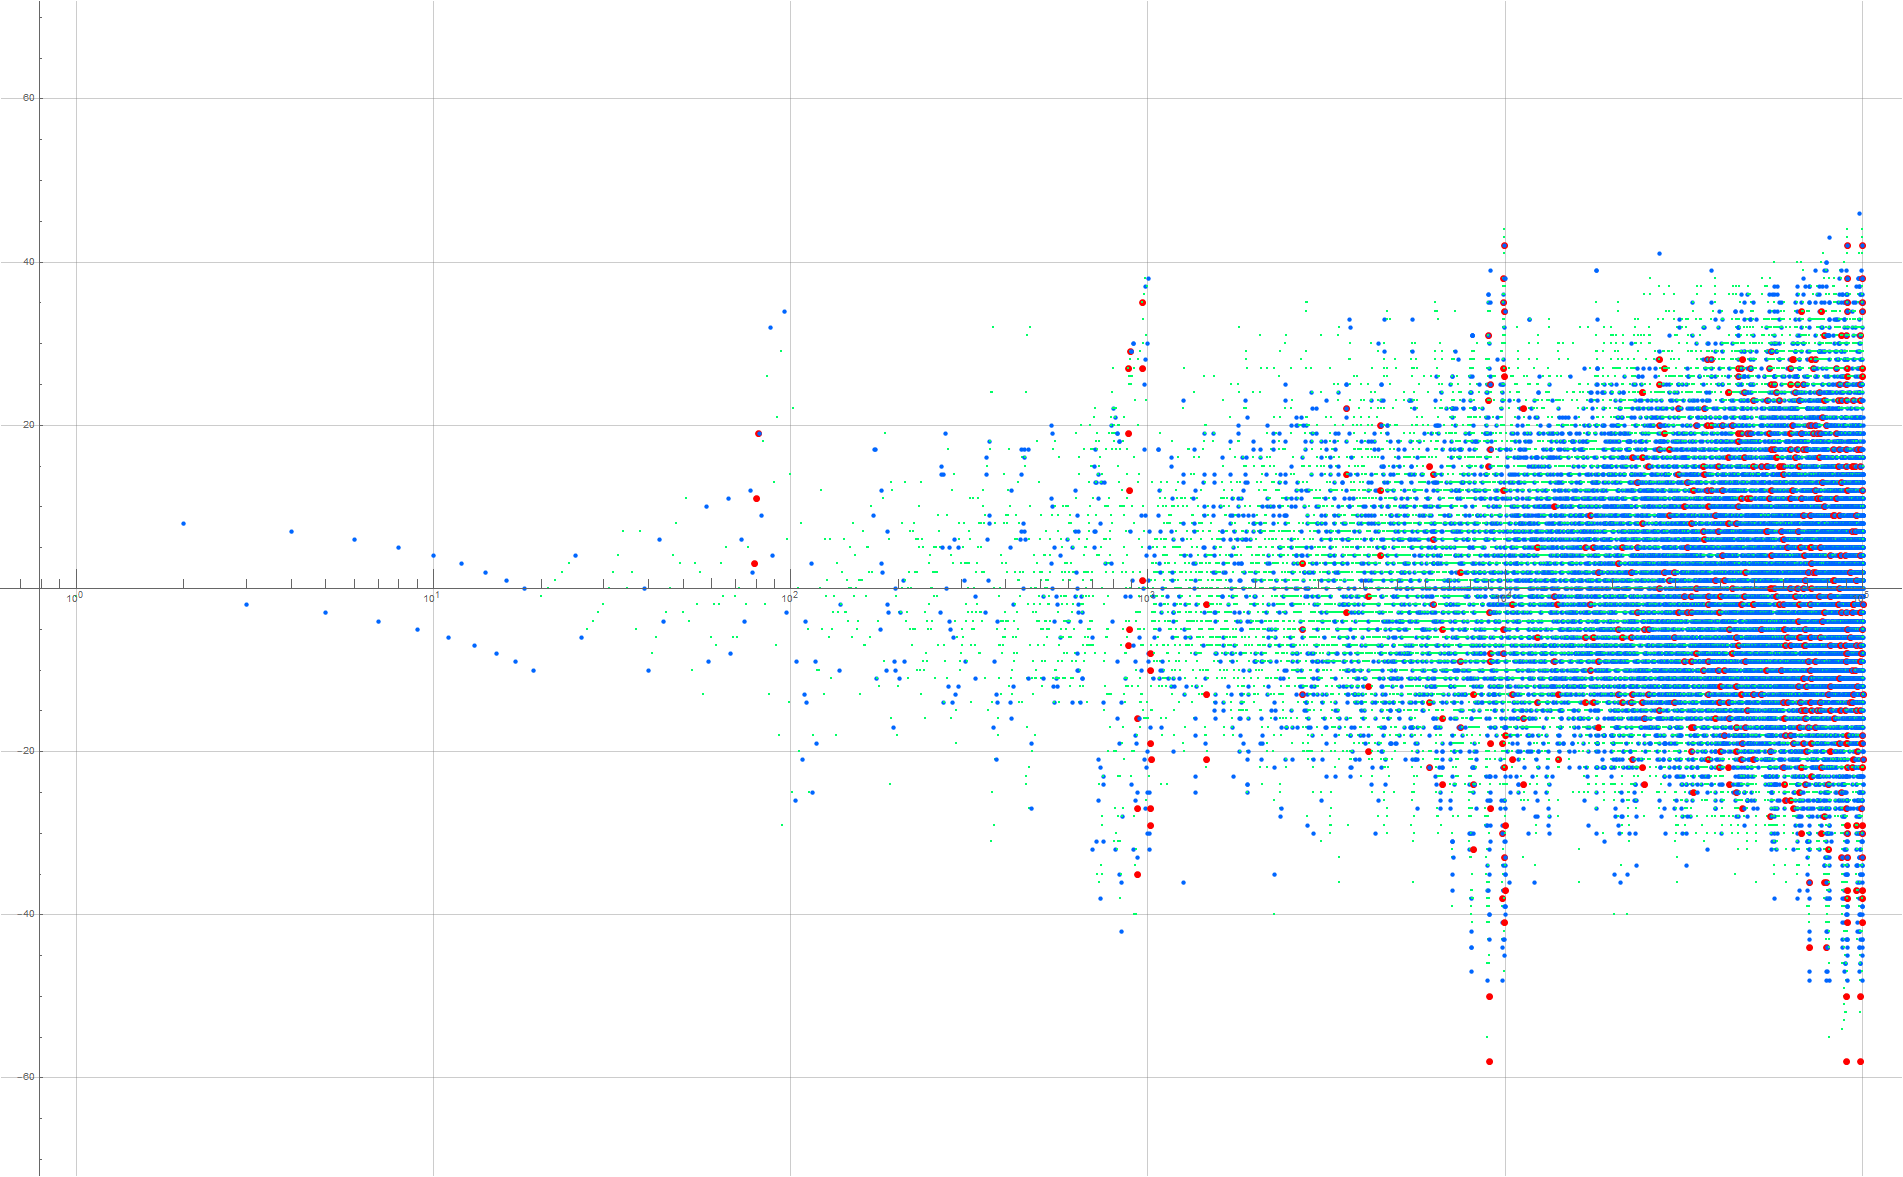
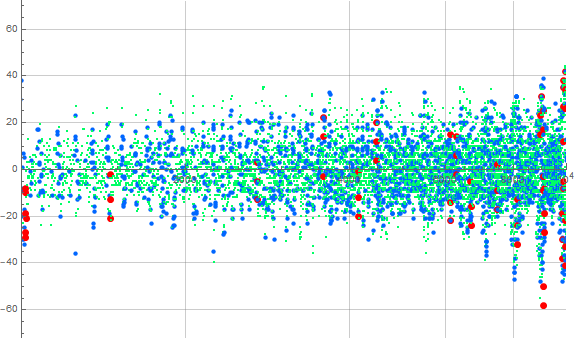
Figure 4.2 plots (x, y) = (n, a(n) − n) for 1 ≤ n ≤ 10000, showing ℓ(n) = 1 in small green dots, ℓ(n) = 2 in medium blue dots, and ℓ(n) = 3 in large red dots (see an extended plot showing 1 ≤ n ≤ 105, see Code 4.0).

We see that for intervals 10e..10(e + 1) − 1 with e > 0, we have ℓ(n) = 2 associated with intermediate jumps, ℓ(n) = 3 preceding the closure of ranks, but in interval e = 4, ℓ(n) = 3 also occurs within the interval as well. Let’s focus on a single interval e = 2:
Figure 4.3 shows the aspects in Figure 4.2 but focuses on 1000 ≤ n ≤ 10000:
This plot (Figure 4.3) seems to indicate that repeated invocations (i.e., ℓ(n) > 1) of digital root d are associated with spikes and occur in clusters, episodically with a rather standard displacement or pitch of about n = 90 between them.
Figure 4.4 shows the aspects in Figure 4.3 but focuses on 1000 ≤ n ≤ 2000:

The plot in Figure 4.4 shows the association of ℓ(n) = 2 with a sparser scatter as compared to the general apparent density of singleton d. Furthermore, we see intermediate spikes associated with the double invocation of d. The density of ℓ(n) > 1 appears to be similarly sparse when compared to singletons.
Figure 4.5 focuses on 1200 ≤ n ≤ 1400:

Figure 4.5 demonstrates the clustering of repeated invocations of d, while Figure 4.4 shows that this clustering is rhythmic.
Figure 4.6 shows the same range in interval e = 4, i.e., 12000 ≤ n ≤ 14000:

This plot suggests that the pitch or displacement between successive clusters of repeated invocations of d remains somewhat constant at about 90. One way we can measure the pitch is by seeking repeated d with amplitude α = | a(n) − n | (or simply the positive or negative values of such) distended from 0. (See Code 4.1.) The degree of distension seems to vary, especially with distance from the next interval culmination 10(e + 1). In the range 12000 ≤ n ≤ 14000, we see about 22 rarefactions, about 22.5 within the span of n = 2000; this estimate supports the pitch of 90. Using an algorithm that selects data with ℓ(n) > 1 and positive-only amplitude α ≥ 12 and threshold spacing of 50, we find the clusters to have spacing {100, 98, 74, 89, 102, 169, 181, 272, 88, 83, 104, 86, 88, 89, 282}. We note that we miss the spike at around 12960, and that some intermediate data shifts the pitch significantly.
Figure 4.7 examines the culmination of interval e = 4, i.e., 98000 ≤ n ≤ 100000:
The plot shows various waves at amplitudes that have pitches of approximately 90 and 900 for the smaller- and larger-amplitude waves, respectively. Indeed, applying the algorithm mentioned immediately above, we find support for a pitch of approximately 900 between the larger waves.
A repeated invocation of the digital root d occurs when the digits of a(n), with d among them, also sums to d.
In the progression 82 → 91 → 100, we see d = 1 thrice, with the displacement of 9 between the terms. Indeed the displacements often have absolute value of 9, but we also see progressions 179 → 180 → 189 → 190 (with duplicated d) or 24291 → 24292 → 24301 → 24310 → 24311 (with triplicated d) that associate an increment of 1 with repeated invocation of d. We can also produce jumps as seen in the progression 44 → 68 → 50 → 54, where we repeat d = 5, but see moves greater than 9.
The greatest absolute difference of 73 within a(n) for 1 ≤ n ≤ 100000 appears at indices 9921, 9926, 90921, 90926, 99921, and 99926; these are all singleton moves with singleton neighbors.
Therefore we might surmise that the spiking of the plot a(n) − n is associated with the clustering of repeated invocations of d which perhaps are instigated by the exhaustion of digit d for some rank within the digits of a(n), though singleton d can introduce a spike near the culmination of the interval.
We might group the first differences of a(n) according to the run lengths of a(n) mod 9. For example, we show the range 10 ≤ n ≤ 99:
{{-9, 10}, {-9, 10}, {-9, 10}, {-9, 10}, {-9, 10}, {2}, {2}, {2}, {2}, {2}, {-9, 2}, {2}, {2}, {2}, {3}, {3}, {3}, {4}, {-6}, {3}, {-6}, {13}, {-6}, {-9, 3}, {3}, {13}, {-9, 2}, {4}, {5}, {5}, {-4}, {-5}, {15}, {-14}, {-5}, {14}, {-4}, {5}, {-14}, {24}, {-18, 4}, {5}, {-4}, {6}, {6}, {-3}, {7}, {7}, {-18, 3}, {6}, {-4}, {7}, {7}, {-9, 3}, {8}, {8}, {-9, 2}, {9, 9, 1}, {-9, 10}, {-19}, {29}, {-38}, {46}, {-27, 10}, {-19}, {29}, {-38}, {48}, {-57}, {64}, {-36, 10}, {-19}, {29}}
We separate the differences associated with singletons, doublets, and triplets and total them to arrive at an aggregate effect of the run:
ℓ=1: 2, 2, 2, 2, 2, 2, 2, 2, 3, 3, 3, 4, -6, 3, -6, 13, -6, 3, 13, 4, 5, 5, -4, -5, 15, -14, -5, 14, -4, 5, -14, 24, 5, -4, 6, 6, -3, 7, 7, 6, -4, 7, 7, 8, 8, -19, 29, -38, 46, -19, 29, -38, 48, -57, 64, -19, 29
ℓ=2: 1, 1, 1, 1, 1, -7, -6, -7, -14, -15, -6, -7, 1, -17, -26
ℓ=3: 19
The singletons give rise to the mean moves +3.15789, the doublets −6.6, and the triplet +19.
Applying this to the other intervals, we have:
Singletons Doublets Triplets
---------------- --------------- --------------
1: 1 × +10 4 × +1
2: 57 × +3.15789 15 × -6.6 1 × +15
3: 682 × +0.20088 103 × +6.04854 4 × +28
4: 7061 × +0.50687 938 × +5.59595 21 × +10.3333
5: 71450 × +0.77219 9041 × +3.73775 156 × +6.62821
This technique may not be perfect but supports the visual intuition that repeated invocations of d tend to move a(n) more than singletons, but singletons have greater individual power to displace a(n). That the repetitions cluster and thus have a less dense appearance seem to explain the “fraying” or “braids” that appear as cusps or spikes in the log plot of a(n) − n.
We also observe that the run lengths are not evenly distributed across all the residues within the intervals of a(n) mod 9.
Analysis of a(n) (mod k).
Figure 5.1 is a plot (x, y) = (n, a(n) − n) for 1 ≤ n ≤ 10000 seeking a parity differentiation among the terms, with even terms in red and odd in blue. The results show that even terms tend to appear sooner than odd for 0 ≤ e ≤ 1, but it is less clear that there is any significant differentiation as e increases:
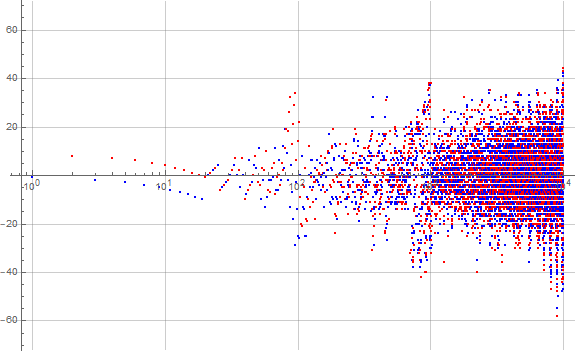
Figure 5.2 plots (x, y) = (n, a(n) − n) for 1 ≤ n ≤ 10000 and shows the residue R (mod 9) ≡ a(n) via color, with red pertaining to R = 0, chromatically through to violet for R = 8. We divide the rgb spectrum by 9 so as to arrive at the colors:

Again, this plot does not seem to show meaningful differentiation according to a(n) mod 9. In examining an enlarged interval (10³ ≤ n ≤ 104) and accentuating R = 6 as an example, we find little that might contribute a method toward generating a(n) without a self-referential algorithm. There seems to be a little horizontal banding amid the terms at indices 10³ ≤ n ≤ 104 that may be attributable to the arrangement of the a(n) − n transform.
Let's look at terms that result from digital root d(a(n − 1)) → a(n), here abbreviated d → a(n). Looking at the case 1 → a(n) for 10² ≤ n ≤ 10³, we find the following terms:
110, 111, 136, 137, 141, 155, 163, 164, 165, 188, 199, 210, 211, 221, 241, 251, 261, 271, 281, 291, 301, 310, 311, 313, 317, 331, 361, 371, 381, 391, 401, 410, 411, 412, 431, 441, 451, 461, 471, 481, 491, 501, 510, 511, 512, 515, 519, 541, 551, 561, 571, 581, 591, 601, 610, 611, 615, 631, 641, 651, 661, 671, 681, 691, 701, 710, 711, 713, 714, 715, 761, 771, 781, 791, 801, 810, 811, 812, 813, 814, 817, 861, 871, 881, 891, 901, 910, 911, 912, 913, 951, 961, 971, 981, 991, 1000, 1001, 1002, 1003, 1004
Note many of the first terms, i.e., those that start with “1”, have d = 1 in a high least rank. The terms 111 and 141 have 1 in rank 0, but many of the available high-rank 1s are missing, having been applied to other d where those d occur in lower ranks. For d > 1, the span of terms that begin with d appear at different points in the interval. For d = 4, we have a range of numbers in the 400s where 4s are available in high rank, but are similarly generally “stolen away” by d ≠ 4 in lower ranks. These higher rank manifestations generally occur in the lower portion of the log plot of a(n) − n and are more apparent for a(n) − n with 10³ ≤ n ≤ 104, as more of these high-rank terms enter the sequence. In the animated Figure 5.3, on the right side of the plot, this is seen as a “trough” rolling rightward in interval 10³ ≤ n ≤ 104 as d increases. Seeing this manifested in that interval we can see similar behavior for earlier intervals, albeit more sparsely plotted.
The numbers in the list above are found in q(1, n) = A011531 at indices:
30, 31, 56, 57, 61, 75, 83, 84, 85, 108, 119, 121, 122, 131, 133, 134, 135, 136, 137, 138, 139, 140, 141, 143, 147, 151, 154, 155, 156, 157, 158, 159, 160, 161, 170, 171, 172, 173, 174, 175, 176, 177, 178, 179, 180, 183, 187, 190, 191, 192, 193, 194, 195, 196, 197, 198, 202, 208, 209, 210, 211, 212, 213, 214, 215, 216, 217, 219, 220, 221, 230, 231, 232, 233, 234, 235, 236, 237, 238, 239, 242, 249, 250, 251, 252, 253, 254, 255, 256, 257, 267, 268, 269, 270, 271, 272, 273, 274, 275, 276
We see that the indices strictly increase as expected, with notable runs of the “stolen” numbers that contain other d. Therefore, some of the “rapid inflation” of the 3-digit numbers in q(1, n) as compared to q(d, n) with d > 1 is skipped through, explaining why the plot of a(n) remains faithful to a line with slope 1.
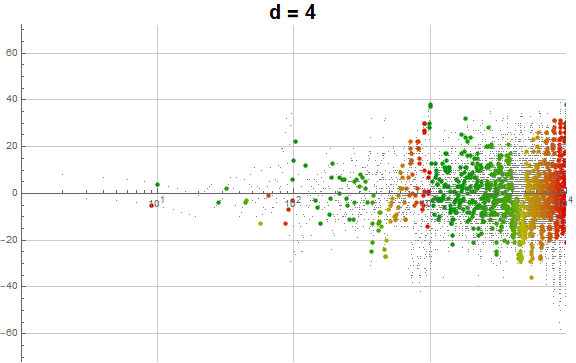
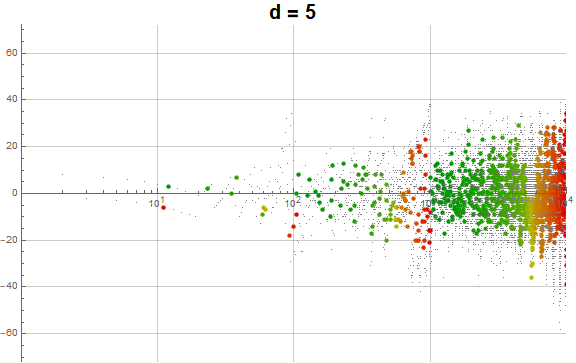
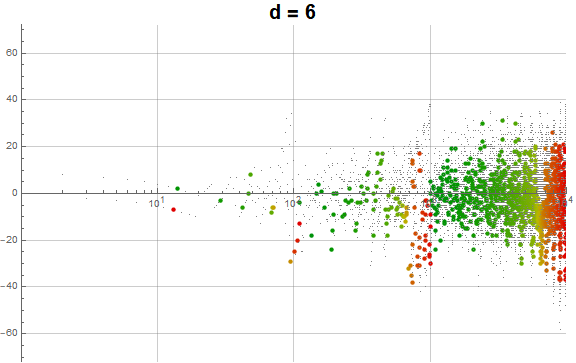
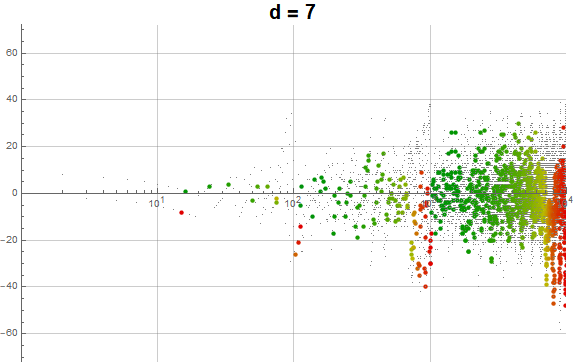
Figure 5.3 is an animation of the log plot of a(n) − n for 1 ≤ n ≤ 104 that runs through 1 ≤ d ≤ 9 in accentuating the exhaustion using the same color coding scheme as Figure 3.2 (Click the following numbers to see still images for d = {1, 2, 3, 4, 5, 6, 7, 8, 9}. Click to see magnified animations of intervals 10(e − 1); ≤ n ≤ 10e with e = {1-3, 2, 3, 4}):

Therefore we see that d → a(n) induces competition among the 9 possible roots d that deny the entry of many numbers in q(d, n) for the digit d in the higher ranks, instead applying them to the digits d in smaller ranks. This process tends to even out the disparity in q(d, n) across d and n constant for n not in A016189.
Conclusion.
The sequence appears to be a permutation of the natural numbers, as there is no prohibition against any m appearing in a(n), and that d(a(n − 1)) may take any value 1..9, where the term 0 with d(0) = 0 is given as the first term. The repetition of the digital root d never exceeds thrice for n ≤ 101000, and we observe an even distribution of R (mod 9) throughout a(n).The least unused term u ≤ n is never very great, often reconciling with n such that n − u = 0.
We had considered several questions related to the mechanics of the sequence.
Regarding the digit d = d(a(n − 1)) that we seek among the digits of m novel to the sequence; we observe that all 1 ≤ d ≤ 9 does appear rather evenly in the sequence, which is tantamount to saying that for n of sufficient magnitude, we see a(n) mod 9 exhibit every residue in just about equal measure. We noted that d = 0 appears only for a(n − 1) = 0. In the plot we see via Figure 5.2 a rather even distribution in the plot, with a hint of sorting for some residues in the positive and negative cusps in the culmination of an interval 10e..10(e + 1) − 1. Otherwise, the distribution of the residues seems random and evenly mixed.
As to the recurrence of the same digital root across successive terms, indeed, we observe singleton d, but also duplicated and triplicated d, therefore we see run lengths 1 ≤ ℓ ≤ 3 with 1 ≤ n ≤ 101000. It is not certain that we won’t see greater run lengths in higher intervals, if more digits in a number offers incentive for longer run lengths. The behavior of terms a(n) with ℓ(n) = 1 (singletons) and ℓ(n) > 1 (repeated d) differs. The singletons tend to be less restrained than the repetitions, which often find differences of 9 or 10, but can indeed be as little as 1. The greatest differences | a(n) − a(n − 1) | pertain to singletons amid singletons, yet the repetitions tend to precede cusps and the culminations in an interval are fraught with them. This might be so because repetitions are seen to have a greater move on average as compared to the average singleton move in the range of n studied. Therefore, because of the lesser density and the clustering of repeated invocations of d, especially as we complete an interval of n, we see cusps in the log plot of a(n) − n or the frays or braids in the plot of a(n).
What remains unexplained are the intermediate lesser and greater cusps and their pitches of about 90 and 900, respectively.
We have shown and illustrated the occasion of repetition of the digit d in runs from 1 through 3 inclusive for n ≤ 101000, and we have enumerated their appearance for 10e ≤ n ≤ 10(e + 1) − 1. Singleton d are the most common, between 4 and 8 times the occasion of duplicated d, which in turn is about 24 to 60 times more common than triplicated d. It is unknown whether we might see quadruplicated d or even longer runs of d. Figures 4.2, 4.3, and 4.7 demonstrate the clustering of repeated instances of d as the interval 10e ≤ n ≤ 10(e + 1) − 1 culminates. Figures 4.4, 4.5, and 4.6 explores the clustering of repeated instances and their association with cusps in the log plot of a(n) − n (i.e., the frays or braids seen in the plot of a(n)). Again, the pitch—the distance between the clusters—is not fully understood.
Figure 5.1 is a parity map of a(n), showing an even distribution throughout all of the features of the plot. Figure 5.3 demonstrates the effect of the preference for low-rank appearances of d.
Figure 4.1 is a log plot of a(n) − n showing the least rank in the number m where digit d occurs. Indeed, the rank 0 predominates above a line from origin at slope 1, while higher ranks predominate below the line. We conclude that 0 rank occurrences of d in m tend to appear generally early, while d in higher ranks tend to enter late, though we can find instances of high rank in the upper portion, and zero rank in the lower portion.
We have examined the unused numbers in an infinite register U that begins with 1. We have found post facto the least unused number u so as to determine the inferior bound of the plot of a(n). Figure 3.2 employs a function g(n) that ascertains how many numbers with at least 1 digit d remain that have e decimal digits in all. This plot demonstrates the exhaustion of such numbers with e decimal digits and how they relate to the culmination effect within the intervals of the plot. Figure 3.1 shows that the digit d = 1 is depleted first, followed by the other digits in turn till 9 is the last to disappear. The transition through all the digits d occurs either side of n = 10e, mostly after the culmination effect in the log plot of a(n) − n. There is little effect on the magnitude of a(n) in moving to (e + 1) digit numbers, except to provide a fresh batch of numbers containing at least 1 digit d. Nonetheless, the instance of clusters of repeated invocations of d, the general amplitude of a(n) − n, both react to the transition to the next interval.
The slope of 1 seems to support the notion that a(n) is a permutation of the natural numbers, along with the relatively calm displacement from the line.
The “frays” or “braids” which in the log plot of a(n) − n show instead as spikes or cusps appear to be an effect of a generally greater mean difference between a(n) before and after the repeated instances of d as compared to singleton d. The culminations that manifest at close of an interval 10e..10(e + 1) − 1 seem to be attributable to the heightened occasion of repeated d.
There are a few unanswered questions regarding the sequence a(n), whose plot is amazingly serene given the differences seen in q(d, n) across 1 ≤ d ≤ 9 at the same value of n, especially away from n in A016189.
Appendix:
Code 1.0: Generate a(n) and store it in variable a:
a = Nest[Append[#,
Block[{k = 1,
r = Mod[#[[-1]], 9] + 9 Boole[Mod[#[[-1]], 9] == 0]},
While[Nand[FreeQ[#, k], ! FreeQ[IntegerDigits[k], r]], k++]; k]] &
@@ {#, Length@ #} &, {0, 10}, 10100]
With[{nn = 10^3},
ListPlot[a[[1 ;; nn]], ImageSize -> Full, AspectRatio -> 1, GridLines -> Automatic,
PlotStyle -> Directive[Blue, PointSize[If[nn > 5000, Tiny, Small]] ] ] ]
Code 1.2: Generate the greatest unused number u(n) and the primitive values in u(n):
u = Block[{u = 0},
Array[Block[{}, While[! FreeQ[a[[1 ;; #]], u], u++]; u] &, Length@ a]];
ru = Union@ u;
Code 1.3: Store the high water marks h, the records in a(n) and the recordsetter n:
h = FoldList[Max, a];
rh = Union@ h;
sh = Map[FirstPosition[a, #][[1]] &, records];
Code 1.4: Generate zeros in a(n) − n:
z = Position[Array[a[[#]] - # &, Length@ a], 0][[All, 1]]
Code 1.5: Find superior and inferior indices in the plot of a(n) − n:
With[{s = [Array[a[[#]] - # &, Length@ a], t = [Array[# - a[[#]] &, Length@ a]},
rr = Map[FirstPosition[s, #][[1]] &, Union@ FoldList[Max, s]]
ss = Map[FirstPosition[t, #][[1]] &, Union@ FoldList[Max, t]] ]
With[{nn = 10^3, k = 100},
Show[
ListPlot[{a[[1 ;; nn]], h[[1 ;; nn]], u[[1 ;; nn]]},
ImageSize -> Large, PlotRange -> {{0, nn + k}, {0, nn + k}},
AspectRatio -> 1, GridLines -> Automatic,
PlotStyle -> {Directive[LightGray, PointSize[Small]],
Directive[Darker[Red], PointSize[Small]],
Directive[Darker[Blue], PointSize[Small]]}],
ListPlot[Array[If[FreeQ[records, #], -100,
Labeled[a[[#]], #, Before, LabelStyle -> Darker[Red]]] &, nn],
ImageSize -> Full, AspectRatio -> 1, PlotRange -> {{0, nn + k}, {0, nn + k}},
Axes -> None, PlotStyle -> {Red, PointSize[Large]}],
ListPlot[Array[If[FreeQ[ru, #], -100,
Labeled[a[[#]], #, After, LabelStyle -> Darker[Blue]]] &, nn],
ImageSize -> Full, AspectRatio -> 1, PlotRange -> {{0, nn + k}, {0, nn + k}},
Axes -> None, PlotStyle -> {Blue, PointSize[Large]}],
ListPlot[Array[If[FreeQ[z, #], -100,
Callout[a[[#]], #, Above]] &, nn], ImageSize -> Full,
AspectRatio -> 1, PlotRange -> {{0, nn + k}, {0, nn + k}},
Axes -> None, PlotStyle -> {Black, PointSize[Large]}]
] ]
ListPlot[MapIndexed[#1 - First[#2] &, a[[1 ;; 10^5]] ],
ImageSize -> Large, PlotRange -> {All, {-72, 72}},
ScalingFunctions -> {"Log10", Automatic}, GridLines -> Automatic,
PlotStyle -> PointSize[Small] ]
With[{nn = 10^4}, Show[
ListPlot[Array[a20201008s[[#]] - # &, nn],
ImageSize -> Full, PlotRange -> {All, {-72, 72}},
ScalingFunctions -> {"Log10", Automatic}, GridLines -> Automatic,
PlotStyle -> {LightGray, PointSize[Small]}],
ListPlot[Array[If[FreeQ[rh, #], -100,
Labeled[a20201008s[[#]] - #, #, LabelStyle -> Darker[Red]]] &, nn],
ImageSize -> Full, PlotRange -> {All, {-72, 72}},
ScalingFunctions -> {"Log10", Automatic}, Axes -> None,
PlotStyle -> {Red, PointSize[Large]}],
ListPlot[Array[If[FreeQ[ru, #], -100,
Labeled[a20201008s[[#]] - #, #, LabelStyle -> Darker[Blue]]] &, nn],
ImageSize -> Full, PlotRange -> {All, {-72, 72}},
ScalingFunctions -> {"Log10", Automatic}, Axes -> None,
PlotStyle -> {Blue, PointSize[Large]}] ] ]
runs = Flatten[Function[{w, len},
ReplacePart[w, Array[# -> len &, len]]] @@ {#, Length@ #} & /@
Split[Mod[a, 9]]]
Table[FirstPosition[a, _?(And[IntegerLength[#] == e + 1,
MemberQ[IntegerDigits[#], d]] &)][[1]], {d, 1, 9}, {e, 0, Log10@ Length@ a}]
// TableForm
Code 4.0: Produce plots as in section 4:
With[{lo = 1200, hi = 1400, max = 5, k = -1},
ListPlot[ConstantArray[-100, lo - 1]~Join~
MapIndexed[
Style[#2 - #1, Hue[(#3 + Boole[#3 == 3] - k)/max],
PointSize@ Which[#3 == 1, Small, #3 == 2, Medium, True, Large]] & @@
{#2, #1, runs[[#2]]} & @@
{#1, First[#2] + lo} &, a[[lo ;; hi]]],
ImageSize -> Large, PlotRange -> {{lo, hi}, {-72, 72}},
ScalingFunctions -> {"Log10", Automatic}, GridLines -> Automatic] ]
Code 4.1: Find pitches between cusps in the plot of a(n) − n (requires tinkering):
Block[{lo = 10^3 - 2, hi = 2*10^3 + 2, amp = 12, thresh = 10, s, t},
s = Select[Array[{#, Abs[a[[#]] - #], runs[[#]]} &, hi - lo, lo],
And[Last@ # == 2, #[[2]] > amp] &][[All, 1]];
t = Transpose@ {s, Prepend[Differences@ s, First@ s]};
Differences@
Map[Floor@ Mean@ # &,
Quiet@ ReplaceAll[
SplitBy[Array[{#1, Boole[#2 <= thresh]} & @@ t[[#]] &, Length@ t], Last],
w_ /; w[[1, -1]] == 0 -> Nothing][[All, All, 1]]]]
Concerns OEIS sequences:
A011531 Numbers that contain a 1 = q(1, n).
A011532 Numbers that contain a 2 = q(2, n).
A011533 Numbers that contain a 3 = q(3, n).
A011534 Numbers that contain a 4 = q(4, n).
A011535 Numbers that contain a 5 = q(5, n).
A011536 Numbers that contain a 6 = q(6, n).
A011537 Numbers that contain a 7 = q(7, n).
A011538 Numbers that contain an 8 = q(8, n).
A011539 Numbers that contain a 9 = q(9, n).
A016189 Running sum of A088924 = 10n − 9n.
A081045 Number of instances of digit d = 0 found among the digits of 10n ≤ k ≤ 10(n + 1) − 1.
A088924 Number of k that have at least 1 instance of digit d > 0 in the interval 10n ≤ k ≤ 10(n + 1) − 1.
A212704 Number of instances of digit d > 0 found among the digits of 10n ≤ k ≤ 10(n + 1) − 1.
A229129 Number of k that have at least 1 instance of digit d = 0 in the interval 10n ≤ k ≤ 10(n + 1) − 1.
A248025 Find d(a(n - 1)) in most significant rank of unique m.
A338191 Find d(a(n − 1)) in least significant rank of unique m.
A340138 a(n).
Document Revision Record.
2020 1012 1700 Created.
2020 1013 2200 Add Figure 3.2, questions, conclusion, function g(n) and q(d, n).
2020 1014 1200 Add Figure 5.3 and associated observations.
2021 0121 1530 Add observation of location of a(n) = 10k before n = 10k for k > 0.