OEIS A342909.
A sequence by David Sycamore.
Written by Michael Thomas De Vlieger, St. Louis, Missouri, 2021 0316.
Introduction.
We examine a simple conditional self-referential counting sequence A342909 = a defined as follows:
a(1) = 1; if a(n) is unprecedented in a, then for 1 ≤ k < n, a(n+1) is the number c of a(k) > a(n), else a(n+1) is the number ς of a(k) ≤ a(n).
The sequence a begins:
1, 0, 1, 2, 0, 1, 4, 0, 2, 7, 0, 3, 2, 9, 0, 4, 13, 0, 5, 3, 13, 20, 0, 6, 5, 18, 1, 10, 4, 18, 28, 0, 7, 24, 1, 12, 7, 26, 1, 13, 33, 0, 8, 13, 36, 0, 9, 32, 2, 19, 7, 31, 3, 22, 7, 33, 54, 0, 10, 39, 1, 17, 15, 16, 16, 48, 1, 18, 53, 1, 19, 56, 0, 11, 29, 10, 44, 4, 31, 68, 0, 12, 49, 4, 33, 75, 0, 13, 56, 86, 0, 14, 33, 80, 1, 24, 72, 3, 32, 80, 98, 0, 15, 63, 7, 47, 14, 63, 100, 0, 16, 69, 7, 49, 98, 113, 0, 17, 73, 8, ...
a(2) = 0 because 1 is novel and there aren’t any a(k) > a(n) hence c = 0.
a(3) = 1 because 0 is novel since a(1) > 0, thus c = 1.
a(4) = 2 since 1 is extant since {1, 0} are lesser than or equal to 1, hence ς = 2.
a(5) = 0 since 2 sets a record (and is thus novel). There aren’t any a(k) > a(n) hence c = 0.
a(6) = 1 since 0 is extant and only a(2) ≤ 0, thus ς = 1.
a(7) = 4 since 1 is extant and a(k) ≤ 1 for k in {1, 2, 3, 5}, thus ς = 4.
etc.
There are two conditions. We apply the term “novel” to a number a(n) unprecedented in the sequence a, that is, a(k) ≠ a(n) for 1 ≤ k < n. The term “extant” signifies a number a(n) that already occurs in a, that is, a(k) = a(n) for at least 1 index k < n. Condition 0 applies to novel m, while condition 1 applies to extant m.
Records and zeros.
Among novel m, we have a special case r = a(n) > a(k) for 1 ≤ k < n. Records r instigate m = 0, since by definition, r is unprecedented, hence there aren’t any a(k) > a(n), thus c = 0. Therefore r → 0. The first terms in r are:
1, 2, 4, 7, 9, 13, 20, 28, 33, 36, 54, 56, 68, 75, 86, 98, 100, 113, 117, 141, 151, 154, 165, 176, 191, 216, 217, 234, 239, 288, 325, 335, 337, 351, 356, 380, 399, 451, 456, 476, 516, 517, 520, 561, 596, 644, 672, 739, 764, 826, 833, 862, 882, 900, 950, 954, 1035, 1052, 1103, 1141, ...
The indices i of r are:
1, 4, 7, 10, 14, 17, 22, 31, 41, 45, 57, 72, 80, 86, 90, 101, 109, 116, 148, 152, 160, 164, 169, 183, 196, 221, 256, 262, 268, 303, 343, 359, 369, 381, 422, 428, 432, 474, 498, 506, 528, 540, 548, 576, 607, 652, 675, 762, 767, 838, 866, 916, 922, 992, 1000, 1052, 1068, 1108, 1115, 1187, ...
The first instance of 0 is a(2), which instigates a(3) = 1, since there is 1 number in a that exceeds 0. Thereafter, of course, m = 0 triggers Condition 1. The number 0 is the least possible m in a, since the sequence begins with 1; thereafter, both conditions employ a counting function. Consequently, m is a natural number.
Each instance of m = 0 instigates ς0 that is 1 less than the number of zeros hitherto present in a. For this reason, we have the trajectory r → 0 → ς0. Clearly, ς0 increments after each appearance of 0, and thus, guarantees the appearance of all natural numbers in a so long as we see records r.
The indices j such that a( j) = 0 are:
2, 3, 5, 8, 11, 13, 15, 18, 20, 23, 25, 27, 29, 32, 35, 37, 39, 42, 44, 46, 49, 51, 53, 55, 58, 61, 63, 64, 65, 67, 70, 73, 75, 76, 78, 81, 84, 87, 91, 93, 95, 98, 102, 105, 107, 110, 113, 117, 120, 122, 124, 126, 128, 130, 131, 132, 134, 136, 138, 140, ...
Least unused numbers.
Let u ≥ 0 be the least number that does not occur in a(1…n). Supposing r appears infinitely, ς0 serves as the lower bound for u. We define sequence u as a step function that registers the value u(n) that is the least number that does not occur in a(1…n).
The first values of u are as follows:
0, 2, 2, 3, 3, 3, 3, 3, 3, 3, 3, 5, 5, 5, 5, 5, 5, 5, 6, 6, 6, 6, 6, 8, 8, 8, 8, 8, 8, 8, 8, 8, 8, 8, 8, 8, 8, 8, 8, 8, 8, 8, 11, 11, 11, 11, 11, 11, 11, 11, 11, 11, 11, 11, 11, 11, 11, 11, 11, 11, ...
Table 1 lists the first 34 primitive unused terms u(n), with the first occasion of u at index n. These are the primitive unused terms in a(n) for 1 ≤ n ≤ 218:
k u(n) n
------------------
1 0 1
2 2 3
3 3 5
4 5 13
5 6 20
6 8 25
7 11 44
8 14 75
9 21 93
10 23 167
11 25 186
12 35 224
13 38 431
14 50 487
15 57 669
16 79 897
17 87 989
18 93 1103
19 103 1218
20 156 3517
21 189 4733
22 293 9612
23 511 10543
24 664 14572
25 668 16362
26 806 33629
27 867 45338
28 1182 49083
29 1198 64276
30 1689 99158
31 1701 103247
32 1776 121491
33 2304 140630
34 2450 149414
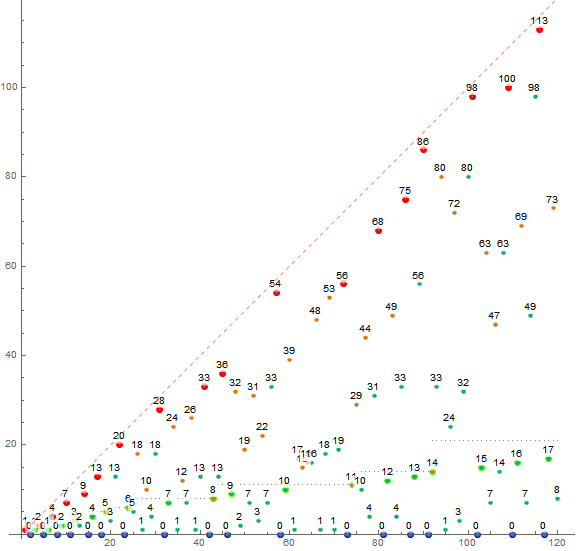
Figure 1: annotated scatterplot of a(n) for 1 ≤ n ≤ 120. Records are shown in large red, novel m appear in orange, extant m are colored green, m = 0 appear in blue, u appears as a gray dotted line, and ς0 is highlighted in brilliant green. The pink dashed line indicates x = n = y.
Upper bound.
We see that the sequence a employs complementary counting functions that assess some fraction of a(1…n) as c or ς. The novel Condition 0 requires c to count the number a(k) > a(n), 1 ≤ k < n, while the extant Condition 1 requires ς, the number a(k) ≥ a(n), 1 ≤ k < n. However, not knowing the membership of m in a, we might consider both values and observe:
c + ς = (n − 1).
Therefore, aside from a(1) = 1, we see that a(n) ≤ (n − 1). Consequently, we may regard the difference (n − r) as a measure of the strength of a given record r.
0, 2, 3, 3, 5, 4, 2, 3, 8, 9, 3, 16, 12, 11, 4, 3, 9, 3, 31, 11, 9, 10, 4, 7, 5, 5, 39, 28, 29, 15, 18, 24, 32, 30, 66, 48, 33, 23, 42, 30, 12, 23, 28, 15, 11, 8, 3, 23, 3, 12, 33, 54, 40, 92, 50, 98, 33, 56, 12, 46, 4, 62, 46, 14, 67, 69, 12, 44, 13, 40, 56, 11, 3, 14, 37, 24, 85, 20, 106, 93, 76, 2, 27, 52, 2, 21, 34, 18, 49, 131, 34, 18, 2, 43, 120, 130, 50, 37, 46, 162, 99, 14, 19, 27, 47, 25, 25, 12, 129, 73, 51, 177, 119, 127, 12, 47, 28, 49, 8, 3, ...
The given a(1) = 1 is a trivial case; for n > 1, records r ≤ (n − 2), since a record is a special case of novel m, and that Condition 0 requires us to report the number c = 0 of previous terms that exceed m, which is by definition of record, 0. Hence we are left with the rule:
For n > 1, 0 ≤ a(n) ≤ (n − 2).
Figure 2: scatterplot of a(n) for 1 ≤ n ≤ 212, Records are shown in large red, terms a(n) instigated by novel m appear in orange, terms a(n) instigated by extant m are colored green, m = 0 appear in blue, u appears as a gray dotted line. The pink dashed line indicates x = n = y. Click here for an extended plot showing 216 terms, with extant-instigated terms in blue and novel-instigated terms in red.
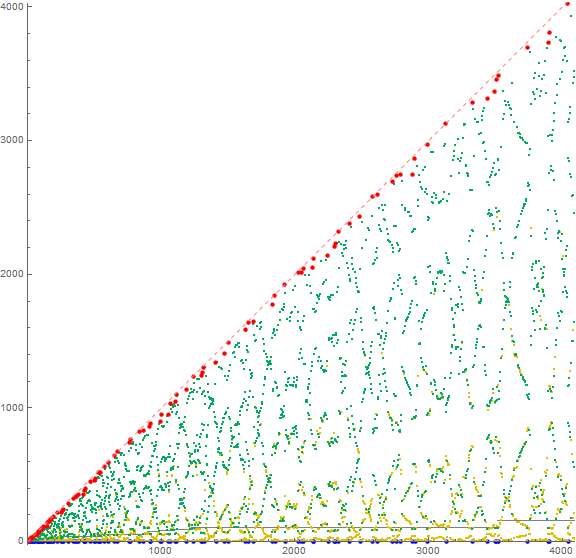
Figure 3: log-log scatterplot of a(n) for 1 ≤ n ≤ 214. The (green) extant-instigated terms m appear at or above the pink step function u. The lowest green trajectory, appearing generally lower than u, is that of ς0. Click to see a log-log scatterplot of 216terms.
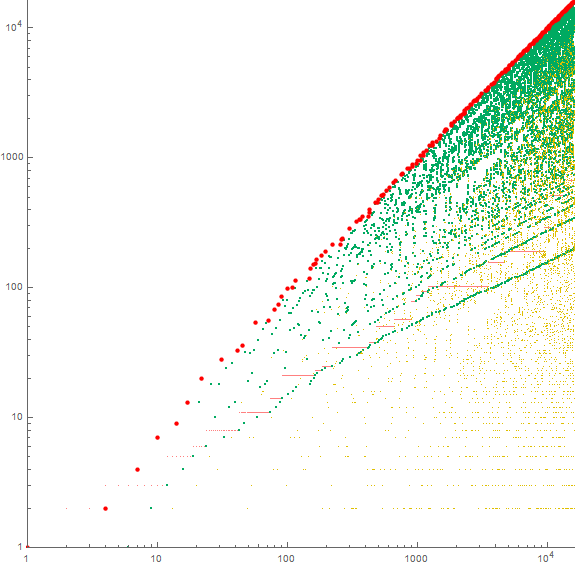
It is evident that the striations seen in green in Figure 3 pertain to ς0, ς1, ς2, etc. We have seen that ς0 is one less than the number of zeros for n > 1. Thus, ς1 registers the number of 0s and 1s, and ς2 registers the number of 0s, 1s, and 2s, etc. that have appeared at a(k) for k < n.
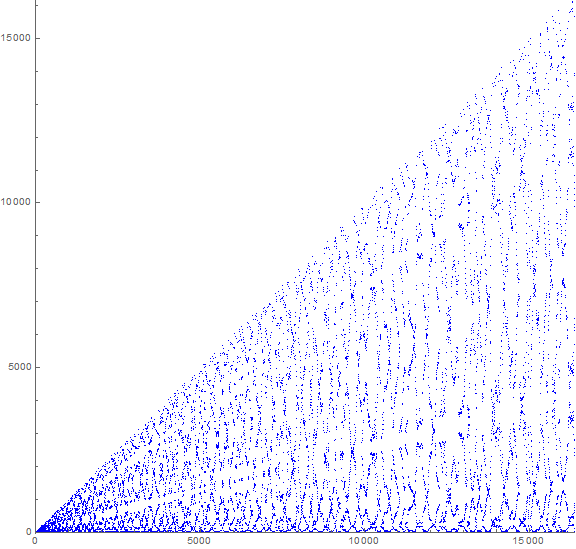
The sequence has a beatiful plot similar to lace or, at larger scale, book-matched woodgrain. There is a certain filamentation and a curious alignment
Figure 4: scatterplot of a(n) for 1 ≤ n ≤ 214. This large-scale plot exhibits a quasi-symmetrical “bookmatching” or lace pattern. Click the following links to see a plot of 217 or of 218 terms.
Ranges of the counting functions.
We know that novel m ≥ u, since, by definition of “least unused” u, all m < u appear at a(k) < a(n) for at least 1 position k. Since a is a function, we see that novel m never instigates a record r; all records r (except the trivial a(1) = 1) result from extant progenitors.
The most effective progenitors of r are those occasions of a second appearance of a previous record, well separated from the first with no interposing new records. Given record a(n) = r, the next record a(k) = r' is r < r' ≤ r + (k − n).
The number c varies inversely to a(n) while ς is larger when a(n) is larger.
Hence, for n > 1, 0 ≤ c ≤ (n − c0 + 2) and c0 ≤ ς ≤ (r + n - i), where a(i) = r is the last record.
Table 2 demonstrates the ranges of the counting functions available for m listed in the column heading. We show c for novel a(n) and ς for extant a(n).
n a(n) | 0 1 2 3 4 5 6 7 8 9 10 11 12 13 14 15 16 17 18 19 20
---------------------------------------------------------------------------------------------
1 1 | . 0
2 0 | 1 .
3 1 | 1 2
4 2 | 2 . 0
5 0 | 1 3 4
6 1 | 2 4 5
7 4 | 4 1 . . 0
8 0 | 2 5 6 6 7
9 2 | 3 6 7 7 8
10 7 | 6 3 1 1 . . . 0
11 0 | 3 6 8 8 9 9 9 10
12 3 | 7 4 2 2 1 1 1 .
13 2 | 4 7 9 10 11 11 11 12
14 9 | 9 6 3 2 1 1 1 . . 0
15 0 | 4 7 10 11 12 12 12 13 13 14
16 4 | 5 8 11 12 13 13 13 14 14 15
17 13 | 11 8 5 4 2 2 2 1 1 . . . . 0
18 0 | 5 8 11 12 14 14 14 15 15 16 16 16 16 17
19 5 | 12 9 6 5 3 3 3 2 2 1 1 1 1 0
20 3 | 6 9 12 13 15 16 16 17 17 18 18 18 18 19
21 13 | 6 9 12 14 16 17 17 18 18 19 19 19 19 20
22 20 | 15 12 9 7 5 4 4 3 3 2 2 2 2 . . . . . . . 0
23 0 | 6 9 12 14 16 17 17 18 18 19 19 19 19 21 21 21 21 21 21 21 22
24 6 | 16 13 10 8 6 5 5 4 4 3 3 3 3 1 1 1 1 1 1 1 .
25 5 | 7 10 13 15 17 18 19 20 20 21 21 21 21 23 23 23 23 23 23 23 24
26 18 | 18 15 12 10 8 6 5 4 4 3 3 3 3 1 1 1 1 1 1 1 .
27 1 | 7 10 13 15 17 19 20 21 21 22 22 22 22 24 24 24 24 24 25 25 26
28 10 | 20 16 13 11 9 7 6 5 5 4 4 4 4 2 2 2 2 2 1 1 .
29 4 | 7 11 14 16 18 20 21 22 22 23 24 24 24 26 26 26 26 26 27 27 28
30 18 | 7 11 14 16 19 21 22 23 23 24 25 25 25 27 27 27 27 27 28 28 29
...
Figure 5: plot of the ranges of c for novel a(n) and ς for extant a(n), with gray signifying low values and orange high values.
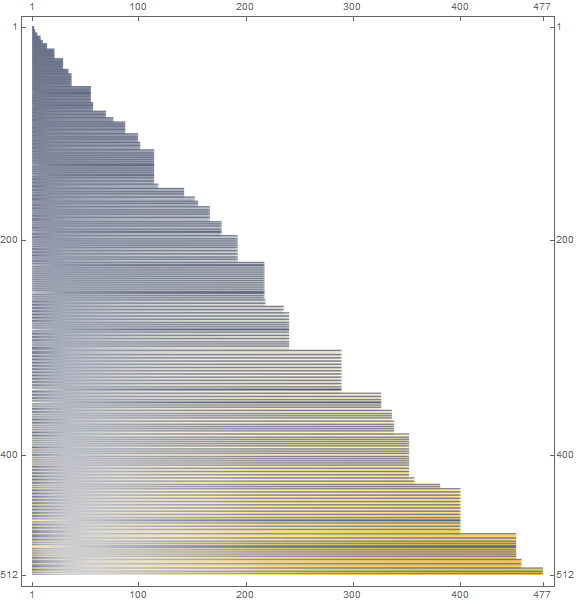
Hence it is evident why we might expect the upper range dominated by extant-instigated terms, and the lower range by novel-instigated terms. Likewise, we see that a given input tends to appear at the other end of the scale, such that a low value becomes a high one, and vice-versa.
Figure 6: scatterplot of a(n) in blue and (n − a(n) + 2) in red for 1 ≤ n ≤ 28. The dashed golden lines plotted have slopes k/8 for 1 ≤ k ≤ 8, demonstrating quasi-symmetry in the scatterplot.
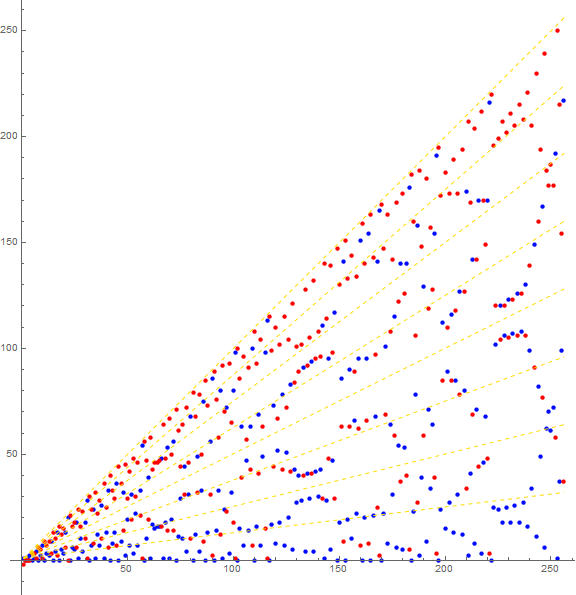
Figure 6 explores the “quasi-complementary” effect of terms. Oftentimes, a(n+2) lands very close to a(n). The displacement of the points of course belies the apparent symmetry. The association with rational slopes, with the exception perhaps of ½, is perhaps an illusion. A scatterplot of a(n) for 1 ≤ n ≤ 218 similar to Figure 4 uses slopes 1/52, 8/91, 1/4, 3/8, 1/2, 5/8, 3/4, and 1 to attempt to align with apparent symmetry lines. Particularly, we note that the line of slope 1/8 does not quite serve as a symmetry line, neither does 1/12, etc. 8/91 seems to visually work well. This seems to imply that the ratios are not really respected by the phenomenon and something else is at work.
Indeed, the counterveiling or, rather, complementary counting functions c and ς lie behind the pseudo-symmetry of the plot.
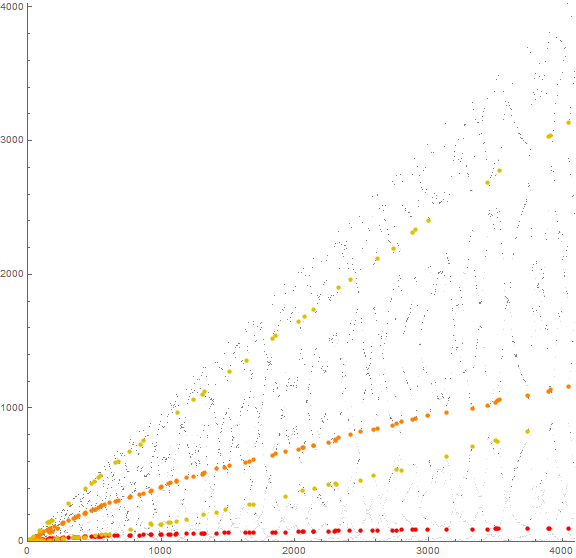
Figure 7: scatterplot of a(n) for 1 ≤ n ≤ 360. The plot tracks select terms 1 ≤ a(k) ≤ 2 for k in {300, 308, 314, 320, 326, 332, 338, 344, 350}, showing these in red. Thereafter, we show a(k + 1) in orange, a(k + 2) in gold, a(k + 3) in lime green, a(k + 4) in spring green, a(k + 5) in blue, and a(k + 6) in purple if a(k + 6) is not in the list of k.
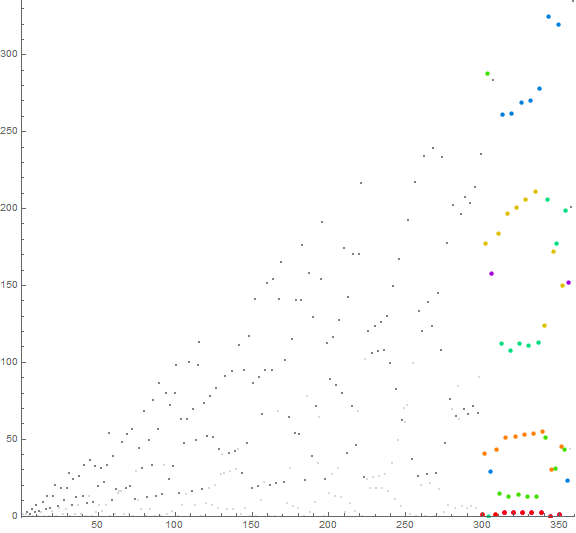
Figure 7 illustrates that each subsequent extant value m in a yields ς' = ς + g. The occasion of a high value of m tends to intensify g, with g = 1 for m = 0. For m = 1, ς is the number of a(k) ≤ 1 for 1 ≤ k < n); for m = 2, ς is the number of a(k) ≤ 2 for 1 ≤ k < n, etc., therefore g may not be a constant as regards m > 0.
At some point, a segment of a starting from a(k) = 0 climbs sufficiently high so as to meet or exceed u, therefore instigate a novel m and trigger Condition 0 and report cm, which is more likely to be small compared to novel m.
We see the leftmost point a(300) = 0 generate the following terms: 1 → 41 → 177 → 288 → 0, where a(303) = 288 is a record. This progression departs from that of many of the other points that set novel a(k + 3), thereby resulting in the lime green points whose values are largely in the teens.
Figure 7 also demonstrates how features in the plot exhibit a distorted “echo”. The points in red give rise to those in orange and yellow, which loosely register the same sort of configuration with increasingly pronounced distortion. Many of the points continue registering a semblance of their values a(k) even when they instigate novel m.
Figure 5: scatterplot of a(n) for 1 ≤ n ≤ 212. Even n appear in red while odd n appear in fainter blue.
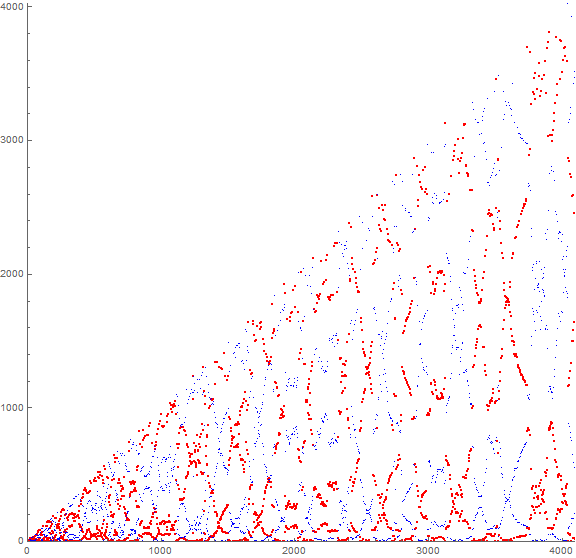
We conjecture that the parity pattern seen in Figure 8 arises because of the tendency for numbers a(n) with n of the same parity to yield terms m = a(n + j) for j even that have values that land near a(n).
Figure 9: scatterplot of a(n) for 1 ≤ n ≤ 212. ς0 is shown in red.
This concludes our examination.
Appendix:
Block[{a = {1}, k},
Do[k = a[[-1]];
AppendTo[a, If[FreeQ[Most@ a, k], Count[a, _?(# > k &)],
-1 + Count[a, _?(# <= k &)]]], 57]; a
]
Document Revision Record.
2021 0406 2200 draft underway