Recursive Totient Sequence.
A sequence of David Sycamore, Mevagissey, England.
Written by Michael Thomas De Vlieger, St. Louis, Missouri, 2021 1006.
Introduction.
Let a(1) = 1; a(n+1) = Sum_{k=1..n} [gcd(a(n), k) = 1], where the brackets are Iverson, yielding 1 if the expression enclosed is true else 0.
This sum equates to the following. Let m = a(n) and let q and k be the quotient and remainder of m/n. Then we may write a(n+1) = q · φ(m) + Sum_{j=1..k} [gcd(k, m) = 1] and we see that the function is related to the Euler totient. Because r is often nonzero, we find minor deviations of a(n+1)/a(n) from the totient ratio φ(m)/m. We shall abbreviate Sum_{j=1..k} [gcd(k, m) = 1] as c(k), that is, the number of reduced residues of m in the range 1..k. Hence, we have a(n+1) = qφ(m) + c(k).
The sequence a begins:
1, 1, 2, 2, 2, 3, 4, 4, 4, 5, 8, 6, 4, 7, 12, 5, 13, 16, 9, 13, 19, 20, 9, 16, 12, 9, 18, 9, 19, 28, 13, 29, 31, 32, 17, 33, 22, 17, 36, 13, 37, 40, 17, 41, 43, 44, 21, 28, 21, 28, 21, 29, 51, 34, 25, 44, 25, 46, 28, 26, 28, 27, 42, 18, 21, 38, 31, 65, 51, 43, 69, 46, 34, 35, 52, 35, 53, 76, 37, 77, 63, 46, 39, 52, 39, 53, 85, 66, 26, 42, 26, 42, 26, 43, 92, 46, 46, 47, 96, 33, 61, 100, 41, 101, 103, 104, 49, 92, 52, 51, 70, 39, 69, 73, 113, 114, 37, 114, 37, 116, ...
We see a(n) < n for n > 1.
This sequence can be generated by Code 1. We have generated 216 = 65536 terms.
Figure 1: Scatterplot of a(n) for 1 ≤ n ≤ 4096.
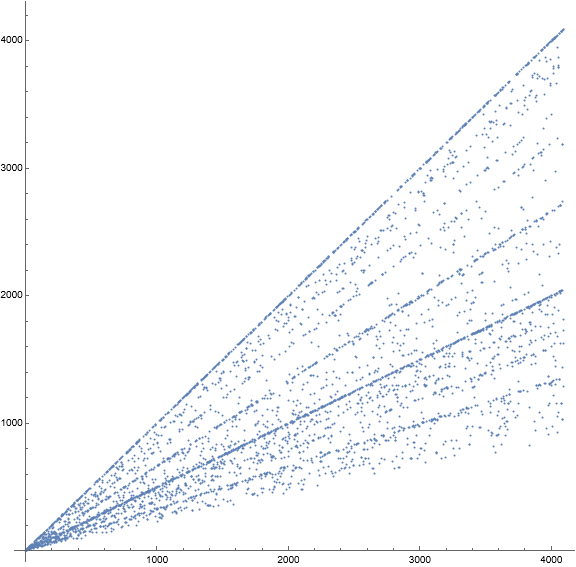
The scatterplot exhibits ray-like features whose slopes correspond to the totient ratio φ(m)/m. The correspondence, however, is approximate due to the incomplete reduced residue range associated with k. The symmetrical arrangement of reduced residues of m about m/2 is therefore interrupted in an arbitrary location, hence, the correspondence of slopes to the totient ratio is close but often impure.
Records r in a begin below:
1, 2, 3, 4, 5, 8, 12, 13, 16, 19, 20, 28, 29, 31, 32, 33, 36, 37, 40, 41, 43, 44, 51, 65, 69, 76, 77, 85, 92, 96, 100, 101, 103, 104, 113, 114, 116, 120, 125, 133, 136, 139, 142, 143, 155, 160, 166, 175, 182, 189, 192, 198, 199, 202, 203, 207, 209, 219, 224, 230, ...
These appear at the following indices:
1, 3, 6, 7, 10, 11, 15, 17, 18, 21, 22, 30, 32, 33, 34, 36, 39, 41, 42, 44, 45, 46, 53, 68, 71, 78, 80, 87, 95, 99, 102, 104, 105, 106, 115, 116, 120, 123, 127, 136, 140, 143, 144, 146, 158, 163, 169, 179, 185, 191, 195, 201, 203, 204, 206, 209, 212, 223, 227, 233, ...
Local minima s in a begin as follows:
1, 2, 3, 4, 5, 9, 13, 17, 18, 21, 26, 33, 35, 37, 43, 48, 49, 50, 61, 63, 68, 73, 81, 94, 97, 121, 141, 149, 162, 177, 187, 193, 228, 253, 266, 290, 312, 313, 321, 348, 356, 362, 435, 449, 481, 507, 577, 606, 642, 650, 651, 694, 723, 731, 746, 769, 826, 905, 961, 977, ...
These appear for the last time at the indices listed below:
2, 5, 6, 13, 16, 28, 40, 43, 64, 65, 93, 124, 132, 139, 142, 154, 171, 188, 202, 235, 238, 277, 305, 387, 425, 454, 614, 653, 670, 730, 735, 843, 1003, 1032, 1043, 1150, 1270, 1272, 1326, 1431, 1470, 1583, 1764, 1962, 2105, 2221, 2343, 2655, 2807, 2842, 2844, 3041, 3167, 3196, 3263, 3573, 3834, 4354, 4624, 4697, ...
Figure 2: Log-log scatterplot of a(n) for 1 ≤ n ≤ 1024, accentuating prime m in green, squarefree semiprime m in gold, and labeling
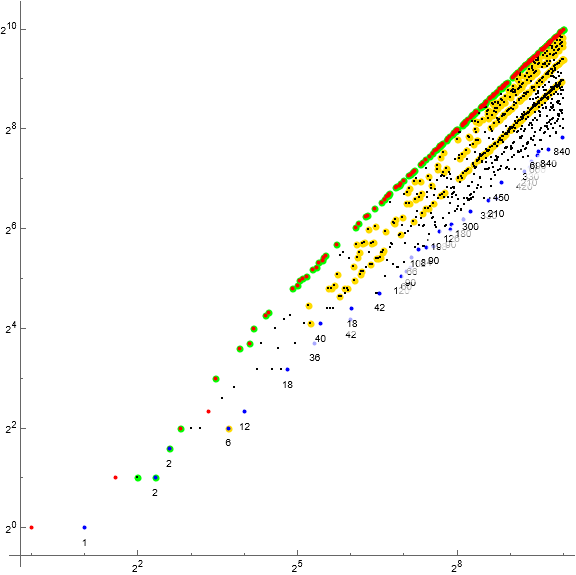
Nearly all records follow primes, which stands to reason since primes maximize φ(m)/m. The local minima correspond to numbers that generally minimize φ(m)/m.
We see that for prime m = p, since the reduced residues inhabit all nonzero k (mod p). Hence, we have a(n+1) ≥ φ(p)/p × n.
The arrangement of terms that arise from squarefree semiprimes has us consider encoding the terms m according to the index N of their prime signature in A025487. We should observe N populating one or more ray-like slopes in the scatterplot.
Figure 3: Scatterplot of a(n) for 1 ≤ n ≤ 256, labeled and color coded according to N. For N = 2, m is prime, since A025487(2) = 2. For N = 3, m is a prime squared, and for N = 4, m is a squarefree semiprime.
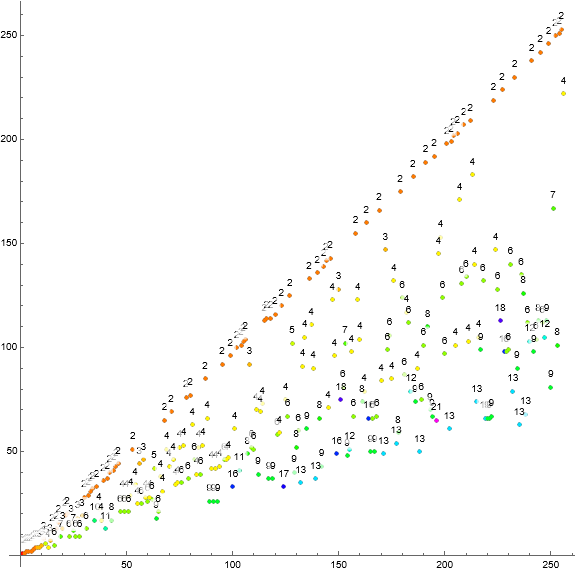
Now we want to explore the actual slopes of the ray-like features using the a(n)/a(n−1), which mimic the totient ratio, but often of course deviating slightly from it on account of the granularity of any interrupted reduced residue system for cases outside m | n.
Figure 4: Scatterplot of a(n) for 1 ≤ n ≤ 127, color-coded as above, but instead labeling the points φ(m)/m.
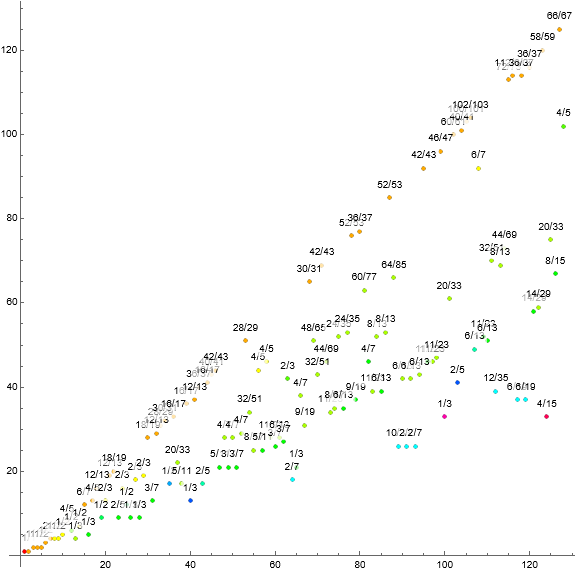
Figure 5: Scatterplot of a(n) for 1 ≤ n ≤ 127, color-coded to illustrate n≡k (mod m), where n ≡ 0 (mod m), i.e., m | n, appears in black.
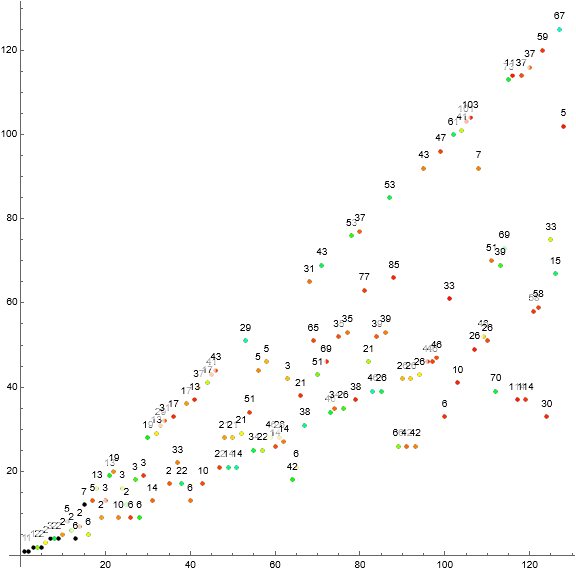
We have m | n at the following indices:
1, 2, 4, 6, 8, 10, 12, 14, 226, 260, 303, 417, 861, 867, 938, 984, 1046, 1226, 1941, 1950, 4134, 4395, 6162, 7305, 7701, 8145, 9124, 9219, 10092, 12302, 13485, 15774, 16692, 17295, 20494, 25677, 29310, 36081, 41511, 51303, 57526, 58347, ...
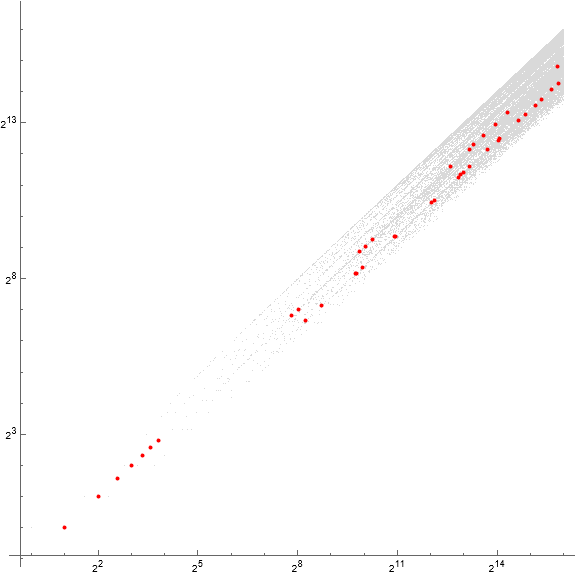
We see that m/n = 2 or 3 for n in the above sequence.
Figure 6: Log-log scatterplot of a(n) for 1 ≤ n ≤ 65536, showing the terms such that m | n in red. Those that have m/n = 2 appear near the center of the strip of terms, while m/n = 3 appear toward the lower side.
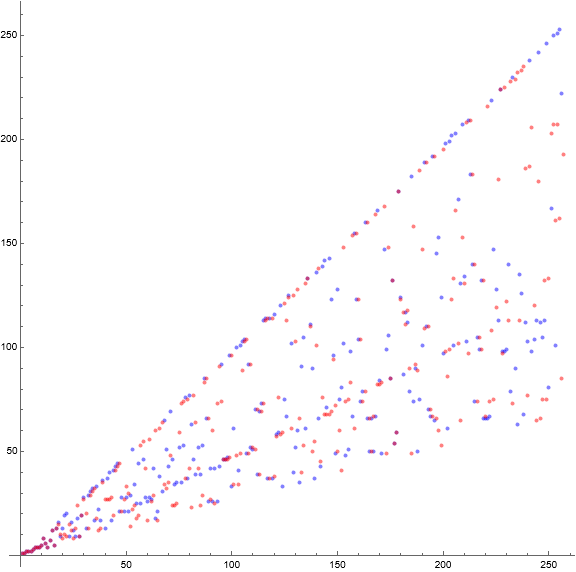
We might surmise we could produce a similar sequence b that dispenses with the incomplete RRS that we encounter using n, and simply take ⌊φ(m)/m × (n − 1)⌋ + 1. This has the effect of matching the first 17 terms of a. However, the sequences differ thereafter. Still, the plot shares some of the same characteristics associated with totient ratio.
Figure 7 is a scatterplot showing a(n) in blue and b(n) in red for 1 ≤ n ≤ 28.
This concludes our examination.
Appendix:
Block[{a = {1}, s = {}},
Do[If[FreeQ[#2, #1],
AppendTo[a, DivisorSigma[0, a[[-1]] ] ],
AppendTo[a, a[[-1]] + First[s] ]; Set[s, Rest@ s]] & @@
{First[#1], #2} & @@ TakeDrop[a, -1];
Set[s, Insert[s, a[[-2]], LengthWhile[s, # < a[[-2]] &] + 1]], {i, 2^14}]; a]
Concerns OEIS sequences:
A000010: The Euler totient function φ(n).
A002110: Primorials P(n) = Product_{k=1..n} p_k.
A007947: Squarefree kernel of n.
Document Revision Record.
2021 1006 2200 Draft.