 |
MapGlossary |
Digit Map
A color-coded plot indicating the arithmetic relationships of nonzero integers k in base n, usually with the range 1 ≤ k ≤ n. The plots employ a color canon or standard palette across this work for consistency. For example, in the map pertaining to decimal (base n = 10) below, divisors appear in red (d ■), semidivisors in orange (ξd ■), semitotatives in yellow (ξt ■), totatives in pale colors, with factors of “omega” (n − 1) in pale blue (tω ■) but otherwise in light gray (t ■). The number 1, both a divisor and a totative of n = 10, appears in purple (u ■).
![]()
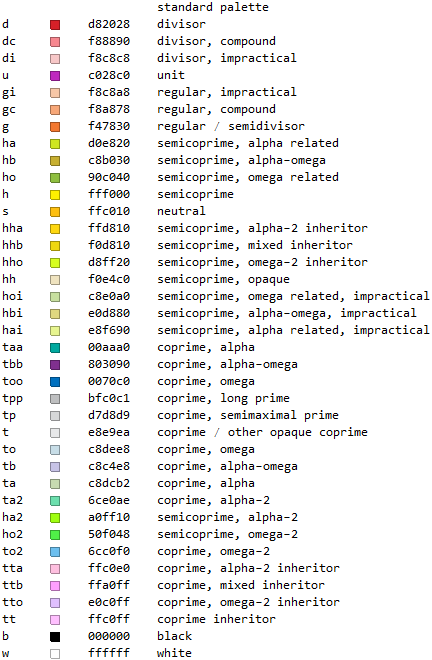
The map intends to facilitate and condense information pertaining to bases n, since the arithmetic behavior of a given number k can be generalized. The color canon appears below.
Several maps for bases can be stacked in rows, with row n containing information pertaining to base n, and the range need not be limited to 1 ≤ k ≤ n. The map below stacks bases 2 ≤ n ≤ 12 in rows. We observe two more arithmetic relationships, that of with factors of “alpha” (n + 1) in pale green (tα ■), and digit 2 in odd bases (tαω ■).
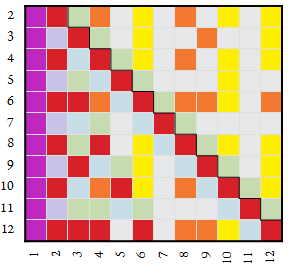
From this map, for instance, we know any divisor d > 1 (■) has the behavior of an n-regular number with richness ε = 1. Such numbers have a complementary divisor d' such that d × d' = n. As denominators of unit fractions expanded in base n, we see one base-n digit (i.e., d') after the radix point; e.g., decimal 1/5 = .2. To test for divisibility of an arbitrary integer x by d in base n, we use the regular divisibility test pertaining to divisors, which involves comparing the last digit of x with a list of possible digits that is d' items long. For instance, in base ten, we know a number is even if it ends in one of 5 numbers, {0, 2, 4, 6, 8}. Given this map, we can deduce that in base 12, to test for divisibility by 3, we observe if the last digit is one of 4 possible numbers {0, 3, 6, 9}. If we know the properties of the arithmetic entity, we can determine what kinds of properties the smallest numbers k exhibit when expressed in base n.
On such maps we may use a sort of Cartesian coordinate system to refer to a given number k in base n, perhaps as (n, k). For example, the number 5 in base 12 appears at (12, 5) and is colored light gray, since gcd(5, 12) = 1 and 5 neither divides (n − 1) nor (n + 1).
Enhanced maps show more information about a given number k in base n. This map enhances the color of many kinds of number, but also principally distinguishes between the coprime factors of semitotatives. In this map, for instance, (12, 5) is colored a bright teal color, since it divides (n² + 1) and is an alpha-2 factor. We see that (12, 10), which in the immediately-above map was a yellow semitotative, appears in bright green below, since it is the product of an alpha-2 factor (5) and a divisor (2). Given the divisibility rules that pertain to these two entities, we deriver a compound divisibility rule for ten in base 12.
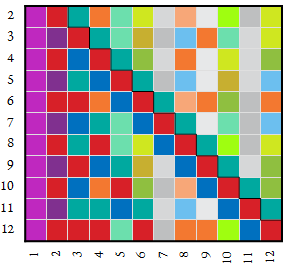
We can selectively screen out certain types of relationship to concentrate attention on them. This map only shows alpha factors tω > 1, which employ the digit sum divisibility test akin to the decimal “Rule of 3”. This test has one add the base-n digits of an arbitrary number x, if the sum is divisible by tω, then so is x. We see that this test pertains to the number 4 in base 9, the number 2 in any odd base, and seems to be wasted on the number eleven in base 12. This test never applies to any k ≥ n.
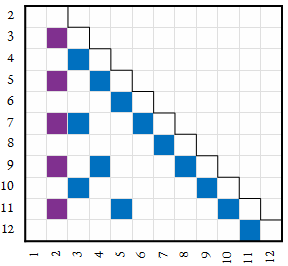
For large bases, we can make the maps more compact thus:

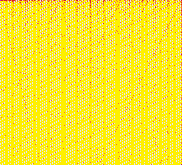
Very large bases can be mapped. Here is a map of base 30030:
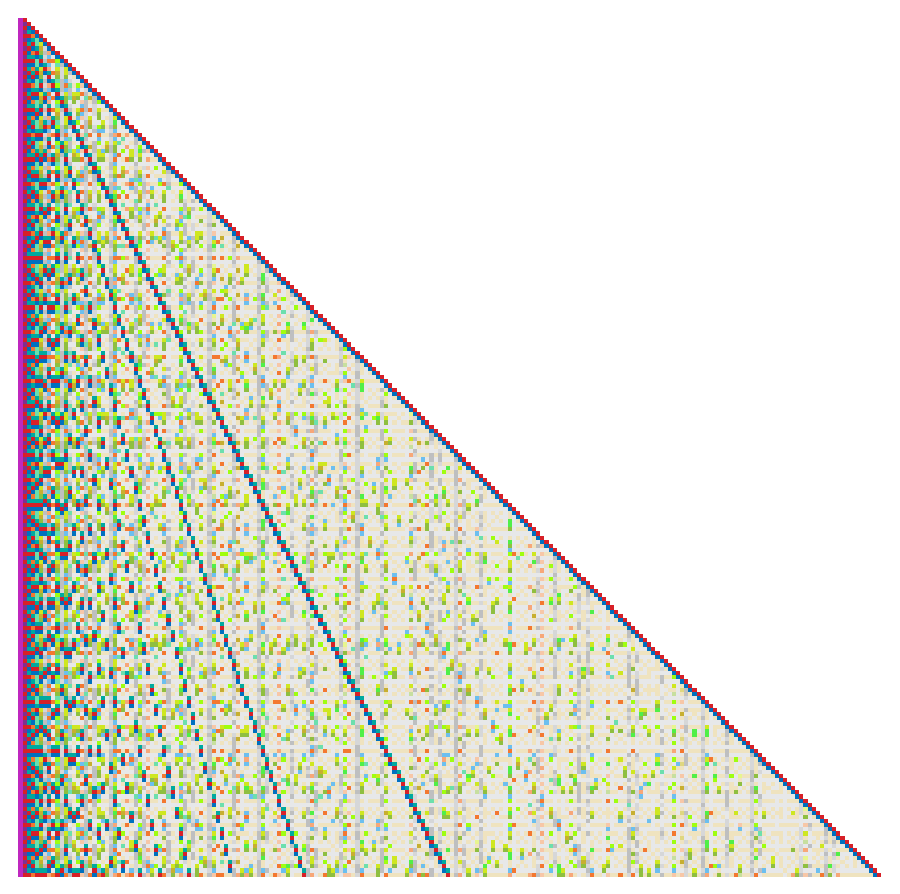
We can also produce large maps and conjecture reasons for patterns we observe therein. Certain integer sequences (e.g., OEIS A244052) explain the prominence of one feature or another. In the case of A244052, numbers that set records for the regular counting function produce more prominently “orange” rows in the map below, which only shows k ≤ n. (See this link for a PNG that shows numbers 1 ≤ k ≤ 2310 for bases 2 ≤ n ≤ 2310.)
The maps serve as a convenient means of summarizing a base's relation to the smallest numbers k, which tend to be the most useful numbers to humanity.
Maps in the OEIS
There are a few sequences in the OEIS that can be used as code to generate monochrome bitmaps similar to the ones above (as number triangles similar to the immediately above):
A051731: Characteristic function of the divisors: 1 if m | n, 0 if not (useful in producing maps).
A054521: Characteristic function of the totatives: 1 if gcd(m, n) = 1, 0 if not.
A304569: Characteristic function of numbers m such that m | n^e with e ≥ 0.* (i.e., regular numbers).
A304570: Characteristic function of numbers m such that m | n^e with e > 1.* (i.e., semidivisors)
A304571: Characteristic function of nondivisors in the cototient of n.* (i.e., neutral numbers)
A304572: Characteristic function of numbers m such that m divides no integer power of n yet gcd(m, n) > 1.* (i.e., semitotatives)
For the latter 4 sequences, code at the OEIS admits generation of the maps in Wolfram Mathematica.
Provenance of the maps
The maps first arose in late 2011 as “digit maps” as they covered the span of digits in base n, with the digit 0 signifying a number congruent to n rather than actual zero. This approach was changed in later maps and the term digit dropped. These maps were a central part of the Tour des Bases that began in early 2012 and existed at DozensOnline through 2017 until the forum hosting algorithm changed and destroyed all the maps. These maps were produced by hand as HTML tables. Algorithms for automatically generating the maps were produced in 2013 and improved in 2016, with the former formulation capable of auto-generating HTML tables. The current algorithm dispenses with the HTML tables in favor of graphics.
In general mathematics, the maps are perhaps a sort of number triangle or plot based on a handful of arithmetic functions. Similar images appeared in Stephen Wolfram's A New Kind of Science, but were generated by cellular automatons.